
Bitcoin price held near $77,700 on Sept. 3 after recovering from an intraday low around $76,264, but weakening spot demand and $236.5 million in US ETF outflows kept the rebound under pressure.
Summary
- Bitcoin price recovered above $77,000 after buyers defended the $76,000–$76,500 liquidity zone.
- US spot Bitcoin ETFs recorded $236.5 million in net outflows during the latest session.
- A falling wedge places immediate resistance near $78,000, followed by $79,500 and $80,300.
- Positive daily money flow and stronger Aroon readings show sellers have not regained full control.
Bitcoin price holds above $77,000
According to data from crypto.news, Bitcoin (BTC) price traded around $77,700 at the time of writing, up about 1.2% over 24 hours after moving between $76,264 and $78,184.
The recovery followed another test of the $76,000 area, where the CoinGlass one-week liquidation heatmap showed a large concentration of leveraged positions. Buyers prevented a sustained break below that zone, allowing Bitcoin to move back toward $78,000.
Price action on the 4-hour chart remains compressed inside a falling wedge. The upper boundary sits near $78,000, while the lower trendline approaches $76,000. Falling wedges can precede an upside move, but Bitcoin has not confirmed a breakout.
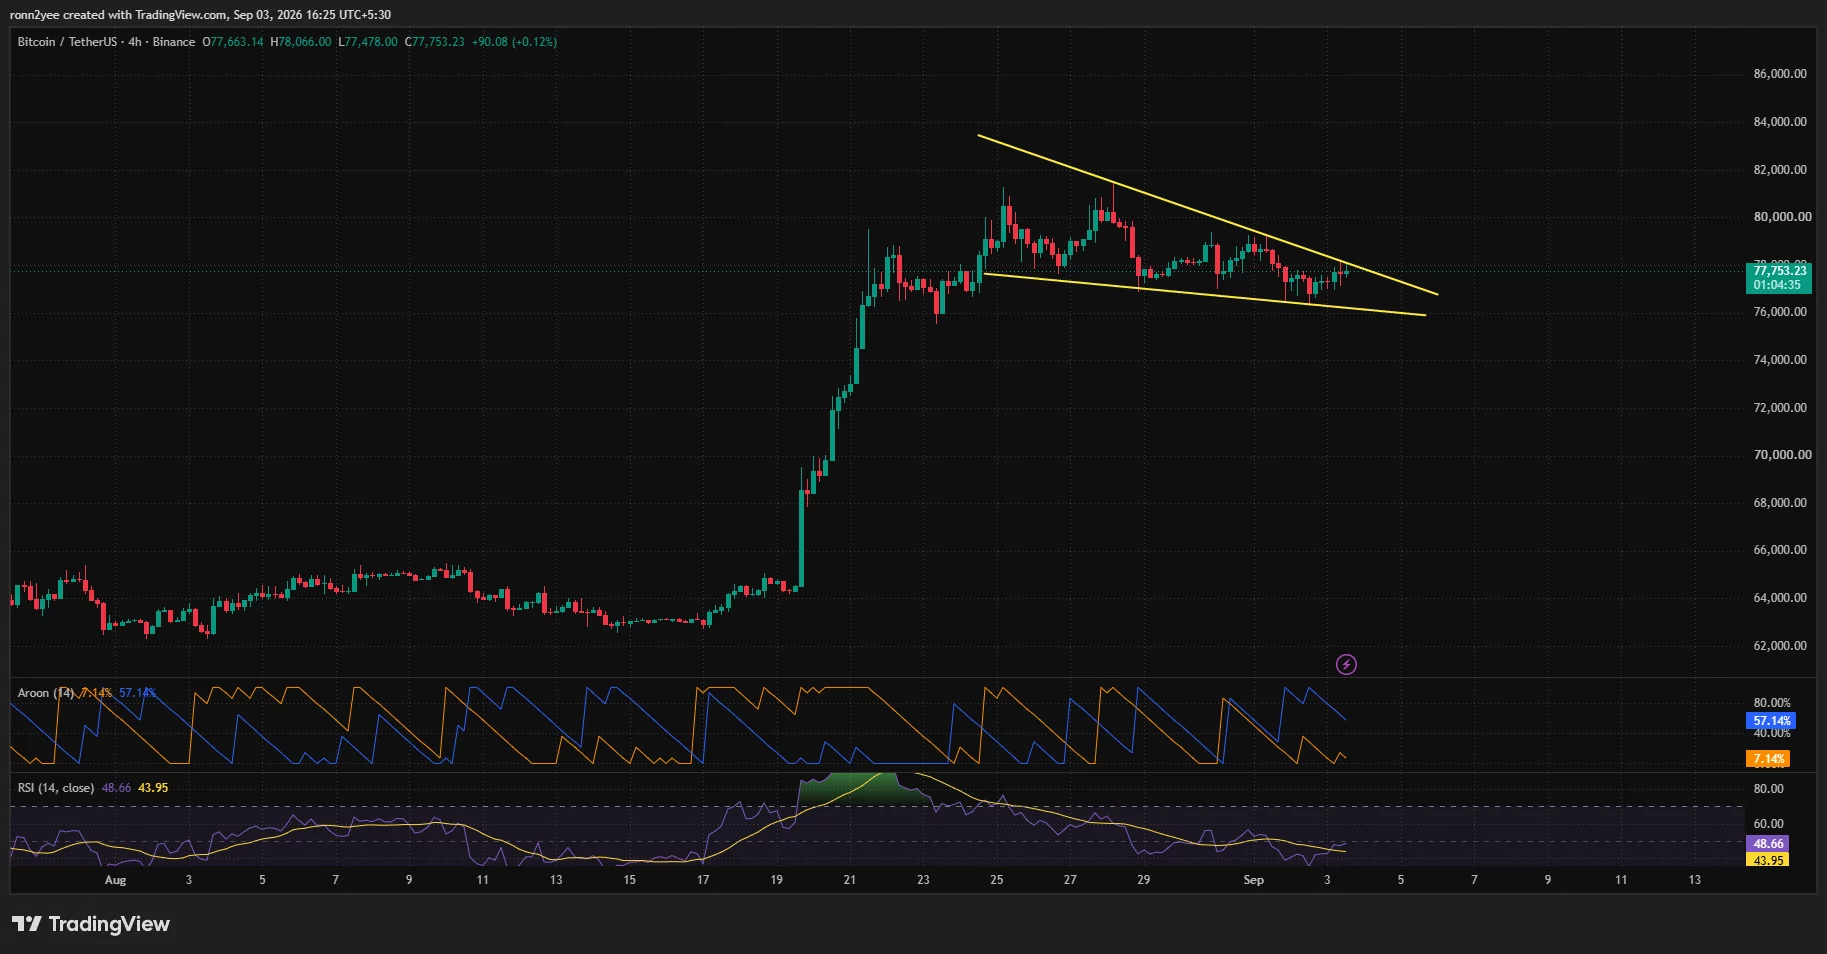
The pattern developed after BTC repeatedly failed to hold above $80,000 in late August. The market has since formed lower highs while continuing to find demand between $76,000 and $77,000.
ETF outflows add to weaker Bitcoin demand
SoSoValue data showed that US spot Bitcoin ETFs recorded $236.46 million in net outflows during the latest reported trading session. Bitwise’s BITB was the only fund to post a net inflow.
The withdrawals removed a source of spot buying as Bitcoin struggled to recover above $78,000. They also followed signs that the demand supporting the August rally was beginning to fade.
CryptoQuant analyst Darkfost reported that Bitcoin’s apparent demand turned negative again on Sept. 2. The metric compares newly mined supply with changes in inactive holdings to estimate whether the market is absorbing available coins.
Market analyst Rain said the negative reading indicated that newly issued and previously inactive Bitcoin was no longer being absorbed at the same pace. Rain linked the change to BTC’s brief decline toward $76,400 and warned that continued weakness could turn $77,000 from support into resistance.
Demand data alone does not determine Bitcoin’s next move, but negative readings combined with ETF withdrawals leave the market more dependent on short-term buyers.
Bitcoin liquidity builds on both sides
The CoinGlass heatmap showed the nearest large downside liquidity cluster around $75,900–$76,200. A break below that area could trigger forced selling and expose $74,000, followed by the 4-hour breakout base near $72,000.
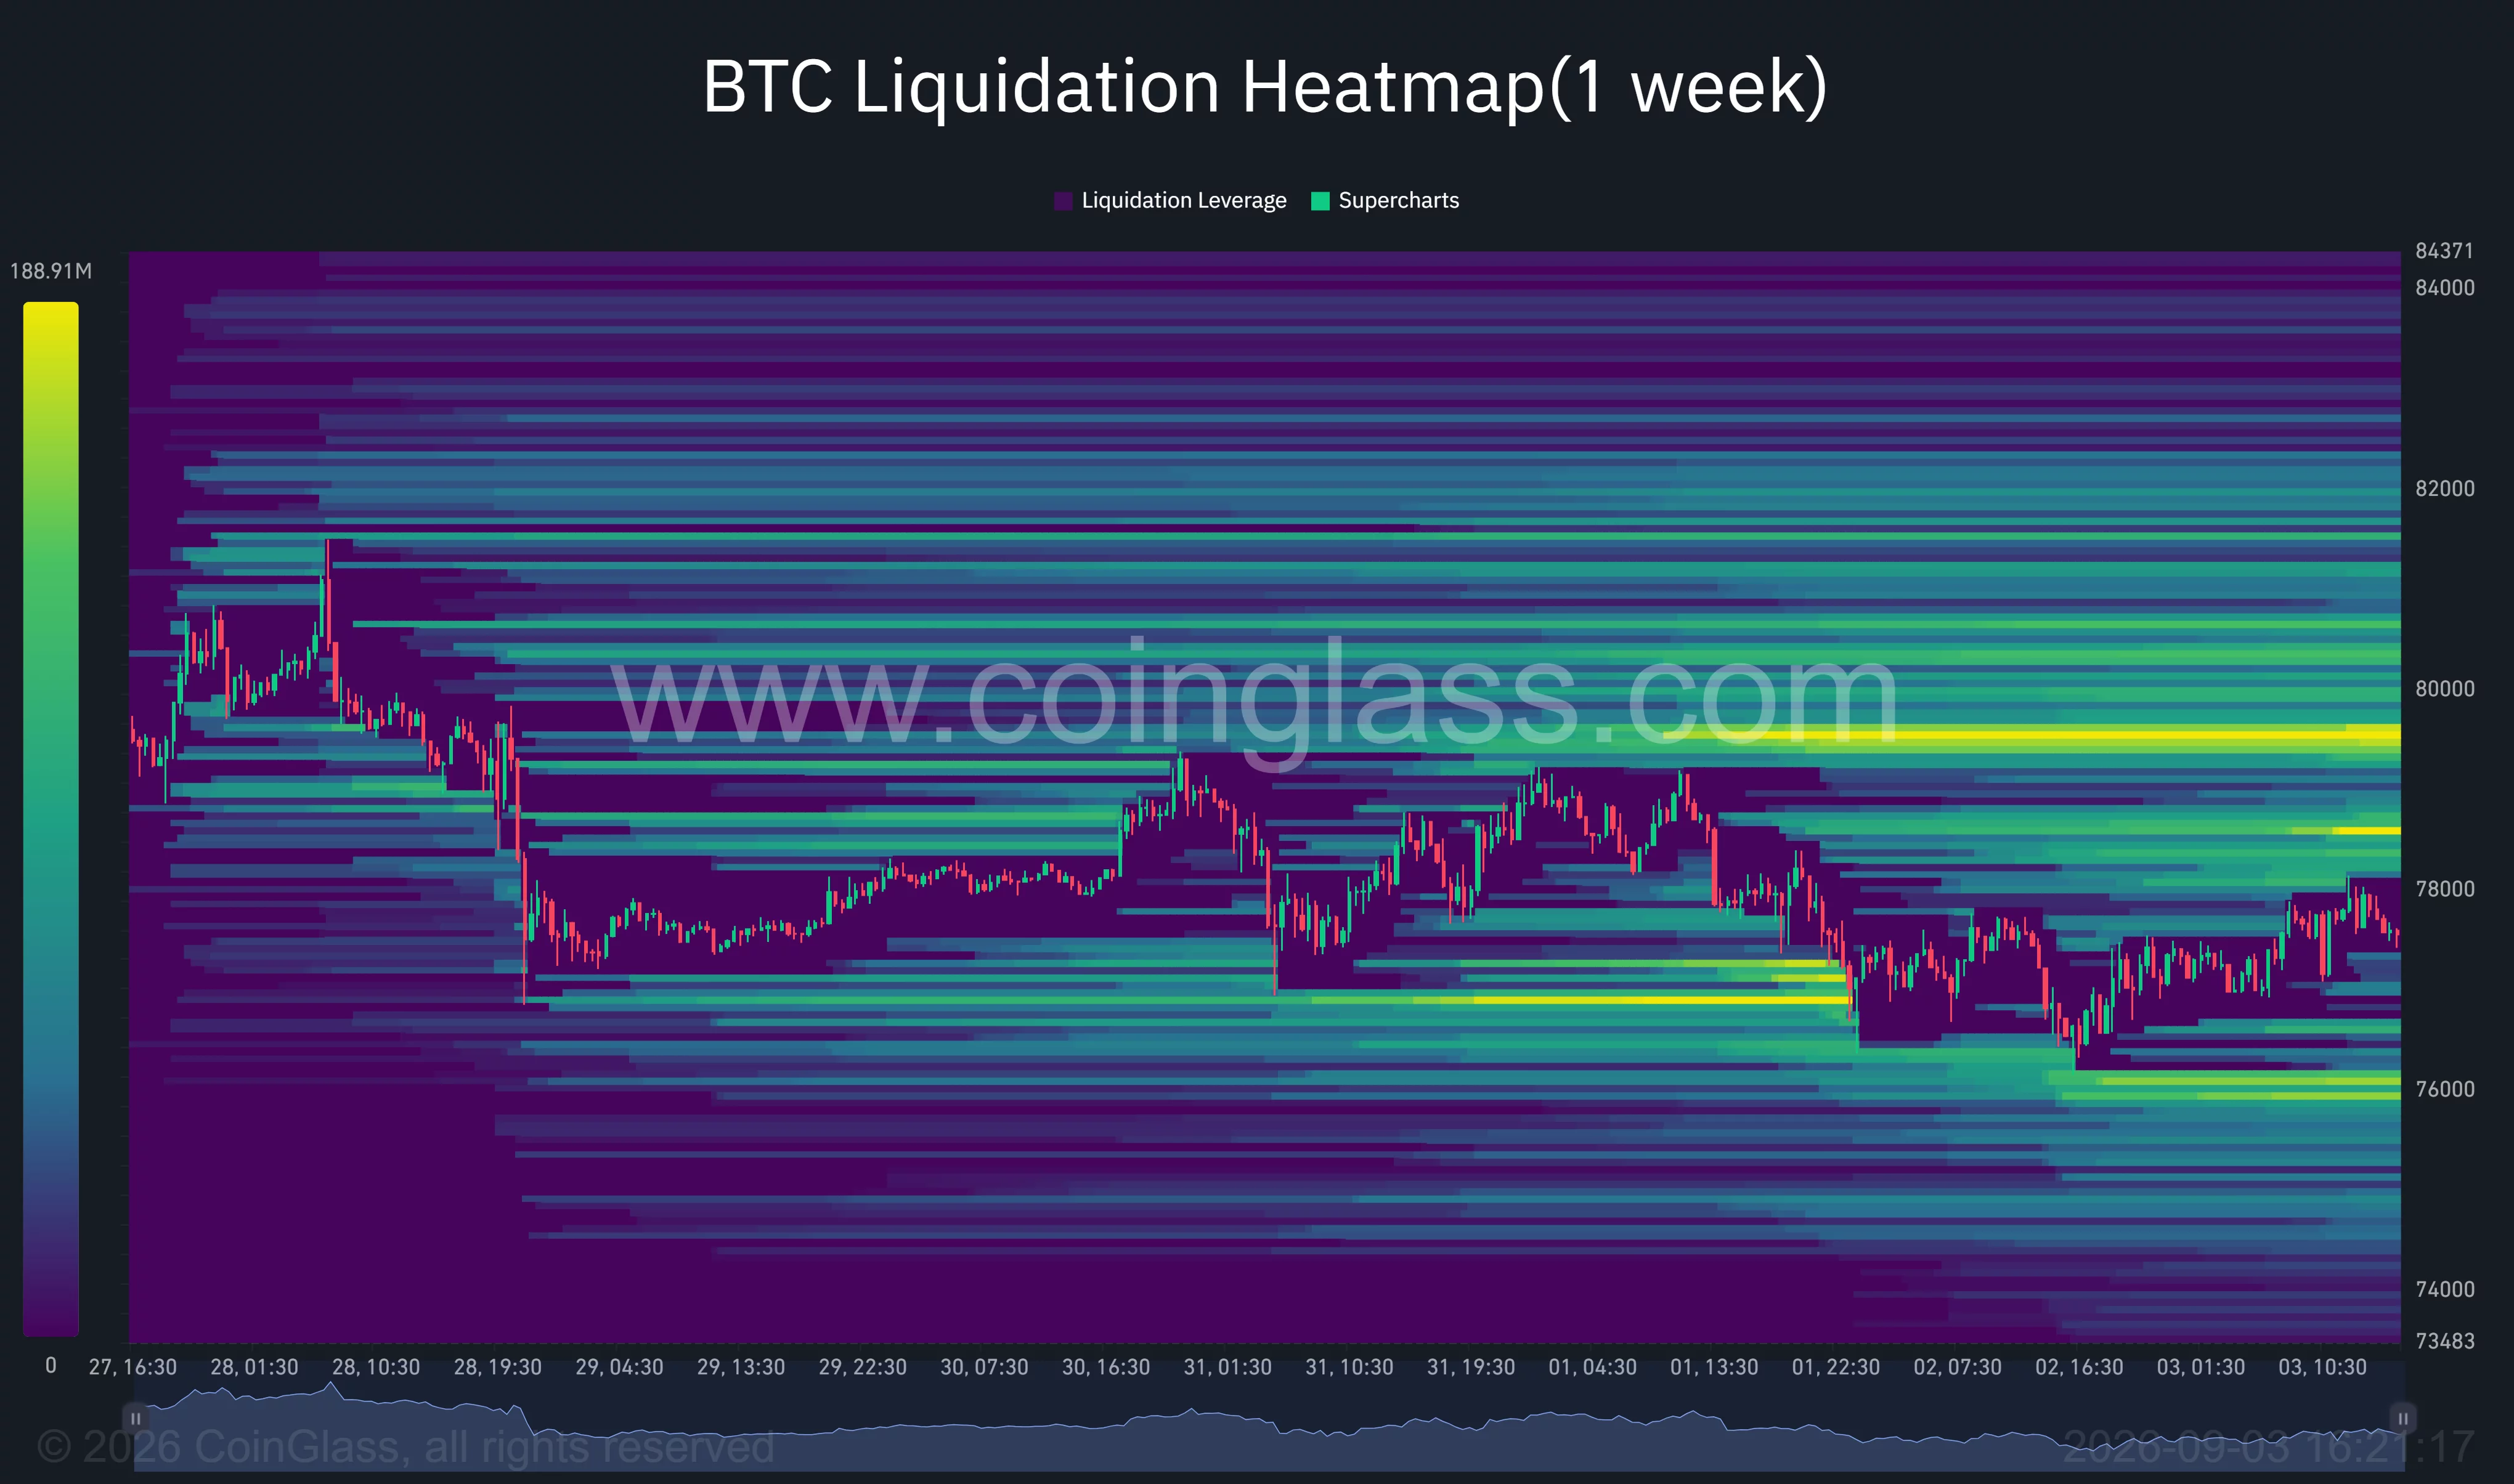
Larger pools of liquidity sit above the current price. The first cluster appears around $78,500–$78,800, with a denser band near $79,500. Further concentrations are visible between $80,000 and $80,500 and around $81,500.
Those levels could attract price if Bitcoin clears the falling wedge, but they may also act as resistance as leveraged traders close positions.
An analyst posting as Crypto with Haris identified $76,000 as the key short-term support. He projected a move toward $73,000 if that floor breaks and said his bearish view would be invalidated if Bitcoin reclaimed and held the $80,000–$83,000 range. His targets represent a personal forecast rather than a confirmed market outcome.
Technical indicators favor consolidation
Bitcoin’s 4-hour relative strength index stood at 48.66, slightly above its signal average of 43.95. The reading reflects neutral momentum and gives BTC room to move in either direction without entering overbought or oversold conditions.
The Aroon Up indicator registered 57.14%, compared with 7.14% for Aroon Down. The gap suggests recent highs are forming more frequently than new lows, giving buyers a limited short-term advantage despite the declining price channel.
The daily chart carries a stronger structure. Bitcoin remained above its 20-day simple moving average at $74,622 and well above the 50-day average at $68,428. The 100-day and 200-day averages stood near $66,303 and $69,586, respectively.
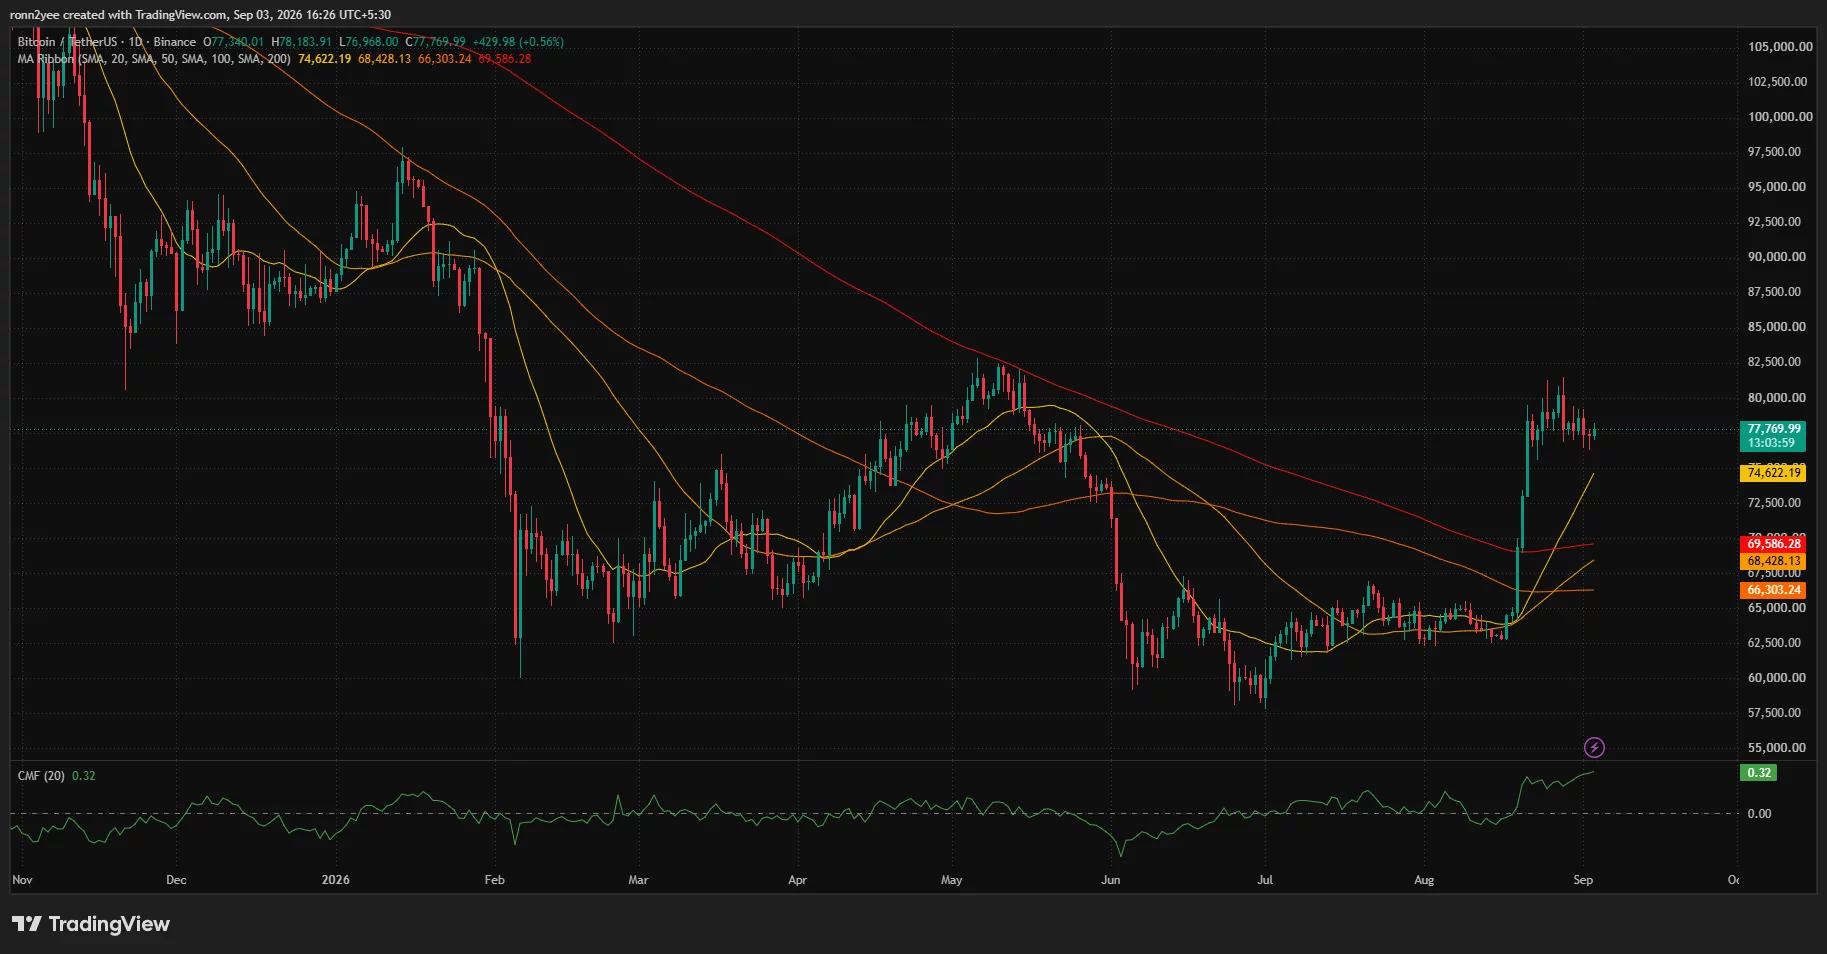
Chaikin Money Flow was positive at 0.32, showing that buying pressure continued to exceed selling pressure on the daily timeframe. The reading conflicts with the weaker apparent-demand signal, indicating that capital flow and on-chain demand have not deteriorated uniformly.
A 4-hour close above $78,000 would break the wedge’s upper trendline and put $79,500–$80,300 back in focus. Bitcoin would then need to clear the May resistance area near $82,800 to strengthen the broader recovery.
Failure to hold $76,000 would weaken the pattern and raise the risk of a move toward $74,000 and $71,800.
Fed rate expectations remain a US risk
US monetary policy remains another source of uncertainty for Bitcoin. Markets assigned about a 64% probability to a 25-basis-point Federal Reserve rate increase at the Sept. 16 meeting, following Chair Kevin Warsh’s warning about persistent inflation.
The 10-year Treasury yield remained near 4.8%, giving investors a higher-yielding alternative to non-yielding assets such as Bitcoin. Reuters reported that government debt, capital demand linked to artificial intelligence investment, and expectations for a higher neutral interest rate were contributing to pressure in the bond market.
For US traders, the immediate setup centers on the $76,000–$78,000 range. A confirmed move outside the falling wedge would provide a clearer signal, while ETF flows and the Sept. 16 Fed decision could determine whether Bitcoin challenges $80,000 or returns toward lower support.
Disclosure: This article does not represent investment advice. The content and materials featured on this page are for educational purposes only.