Key Takeaways
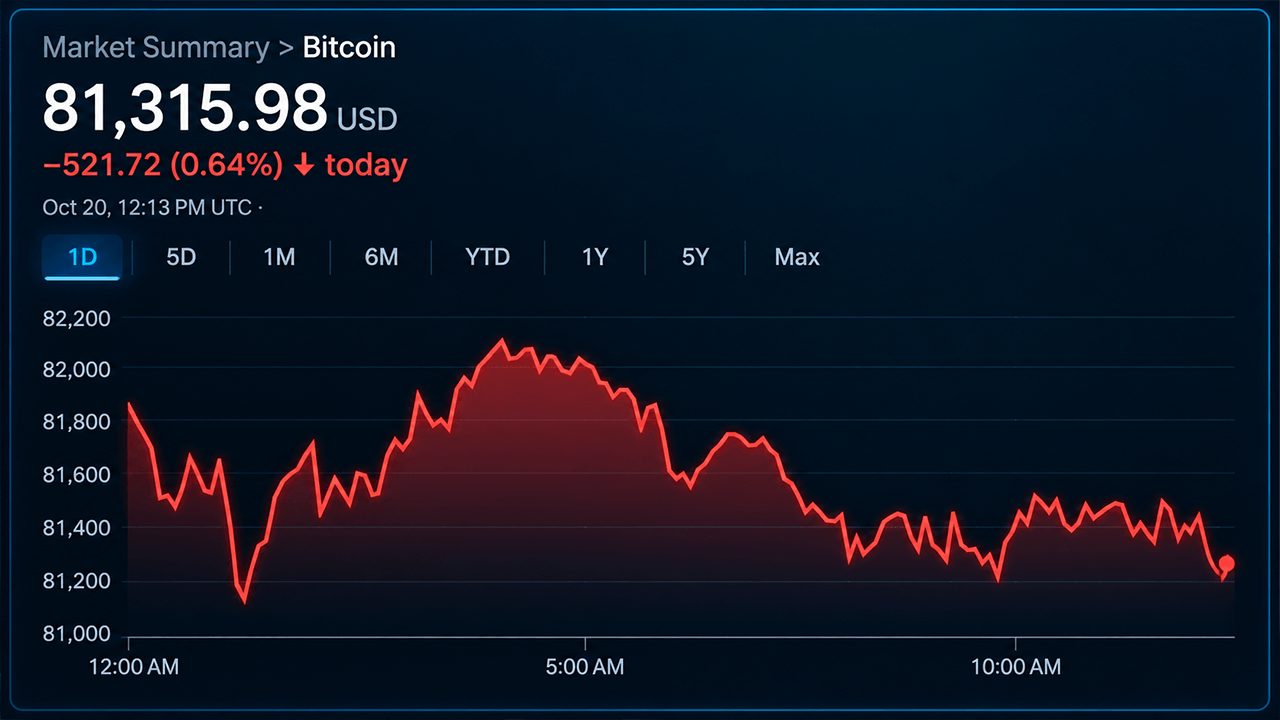
- Bitcoin’s price traded near $81,392 on Oct. 20, with $81,100 emerging as immediate technical support.
- Bitfire Research cites $228 million in weekly bitcoin ETF outflows and weakening U.S. spot demand.
- Bitcoin faces resistance at $82,000 to $83,300, while a breakdown risks exposing $79,800.
With the cryptocurrency slipping toward the bottom of its $81,155 to $82,667 intraday range, technical indicators favoring sellers and Bitfire Research warning of deteriorating macroeconomic conditions, the immediate contest centers on whether buyers can defend $81,100 or allow another retreat toward the psychologically important $80,000 threshold.
Hourly Chart Puts Bitcoin’s $81,100 Floor on Notice
The one-hour chart tells a fairly unforgiving story, with bitcoin’s price establishing lower highs after reaching $83,062 and subsequently struggling to maintain traction around $81,450. Immediate support rests near $81,102, while the $81,900 to $82,000 corridor presents the first meaningful obstacle for buyers.
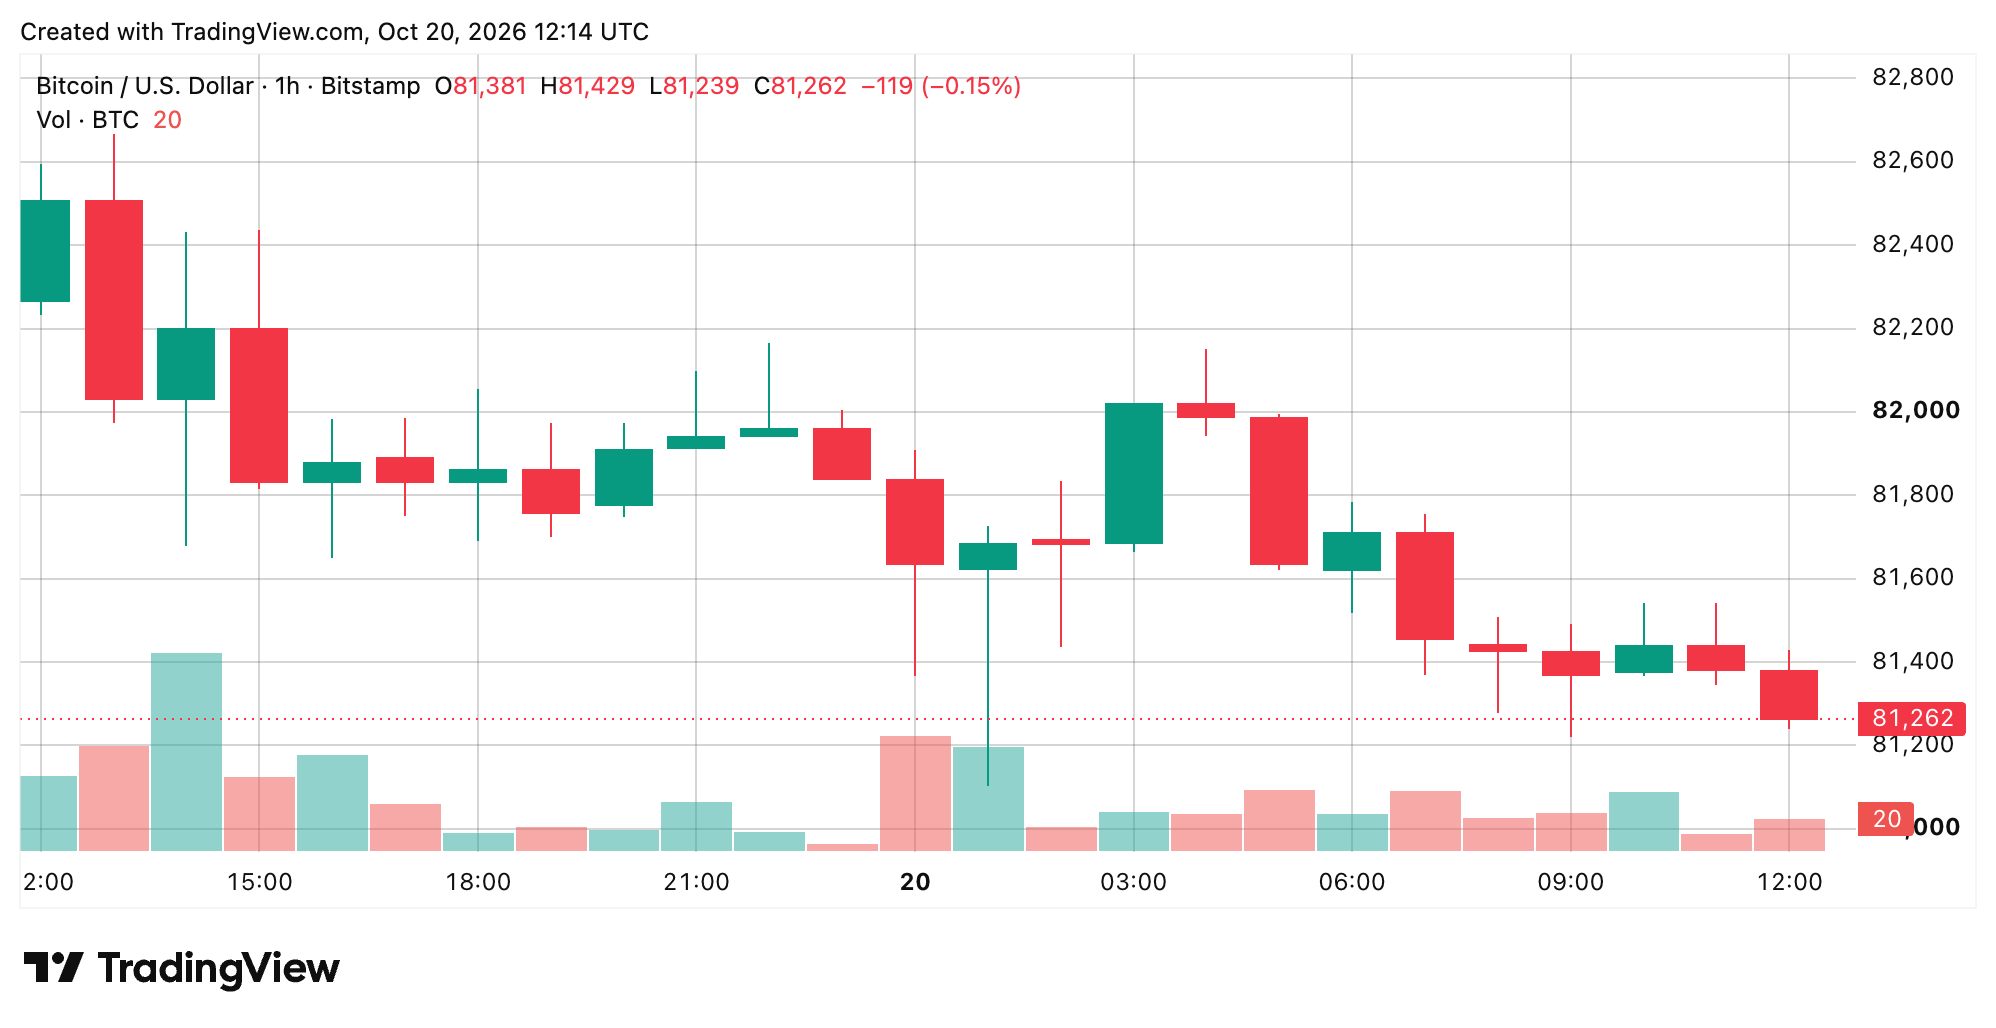
Declining trading volume suggests participation is thinning rather than signaling an aggressive accumulation campaign. A convincing recovery above $82,000, accompanied by stronger volume, would improve the short-term outlook, but another rejection would leave the $81,100 floor exposed.
Four-Hour Chart Reveals a Fragile Defensive Position
Across the four-hour timeframe, bitcoin’s technical structure remains neutral to bearish, with repeated failures around $82,500 to $83,000 keeping sellers firmly in the conversation. Buyers have defended the $80,500 to $81,000 demand region, although their efforts haven’t translated into a convincing directional reversal.
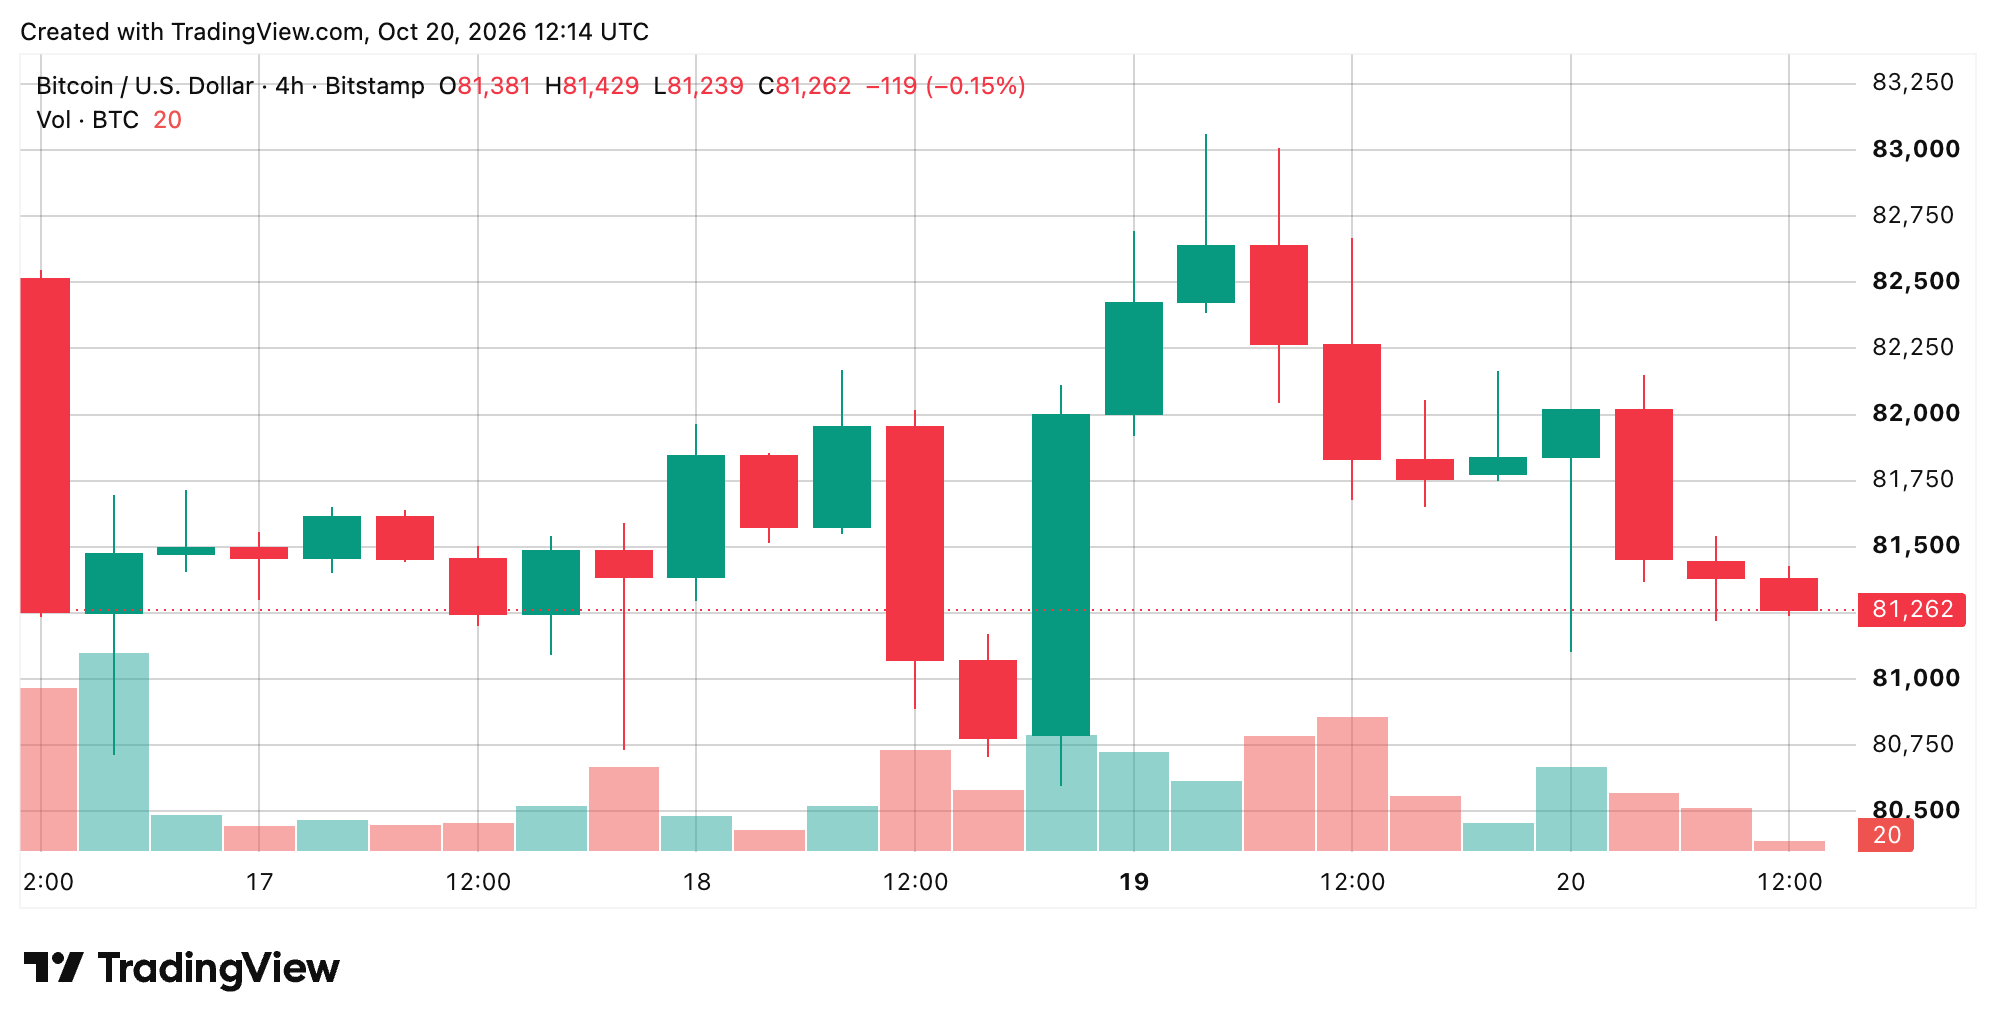
A four-hour close above $82,500 would strengthen the recovery case and potentially invite another challenge of $83,060. Conversely, a sustained breakdown beneath $81,000 would bring $80,500 into focus, followed by the more consequential $79,694 support area.
Daily Chart Keeps Recovery Hopes on a Short Leash
The daily chart offers little immediate comfort, as bitcoin continues consolidating beneath its previous $87,374 high while successive lower highs reflect persistent selling pressure. Recovering the $83,000 to $84,000 region would begin repairing the broader technical structure, whereas a decisive break below $80,000 would strengthen the bearish argument.
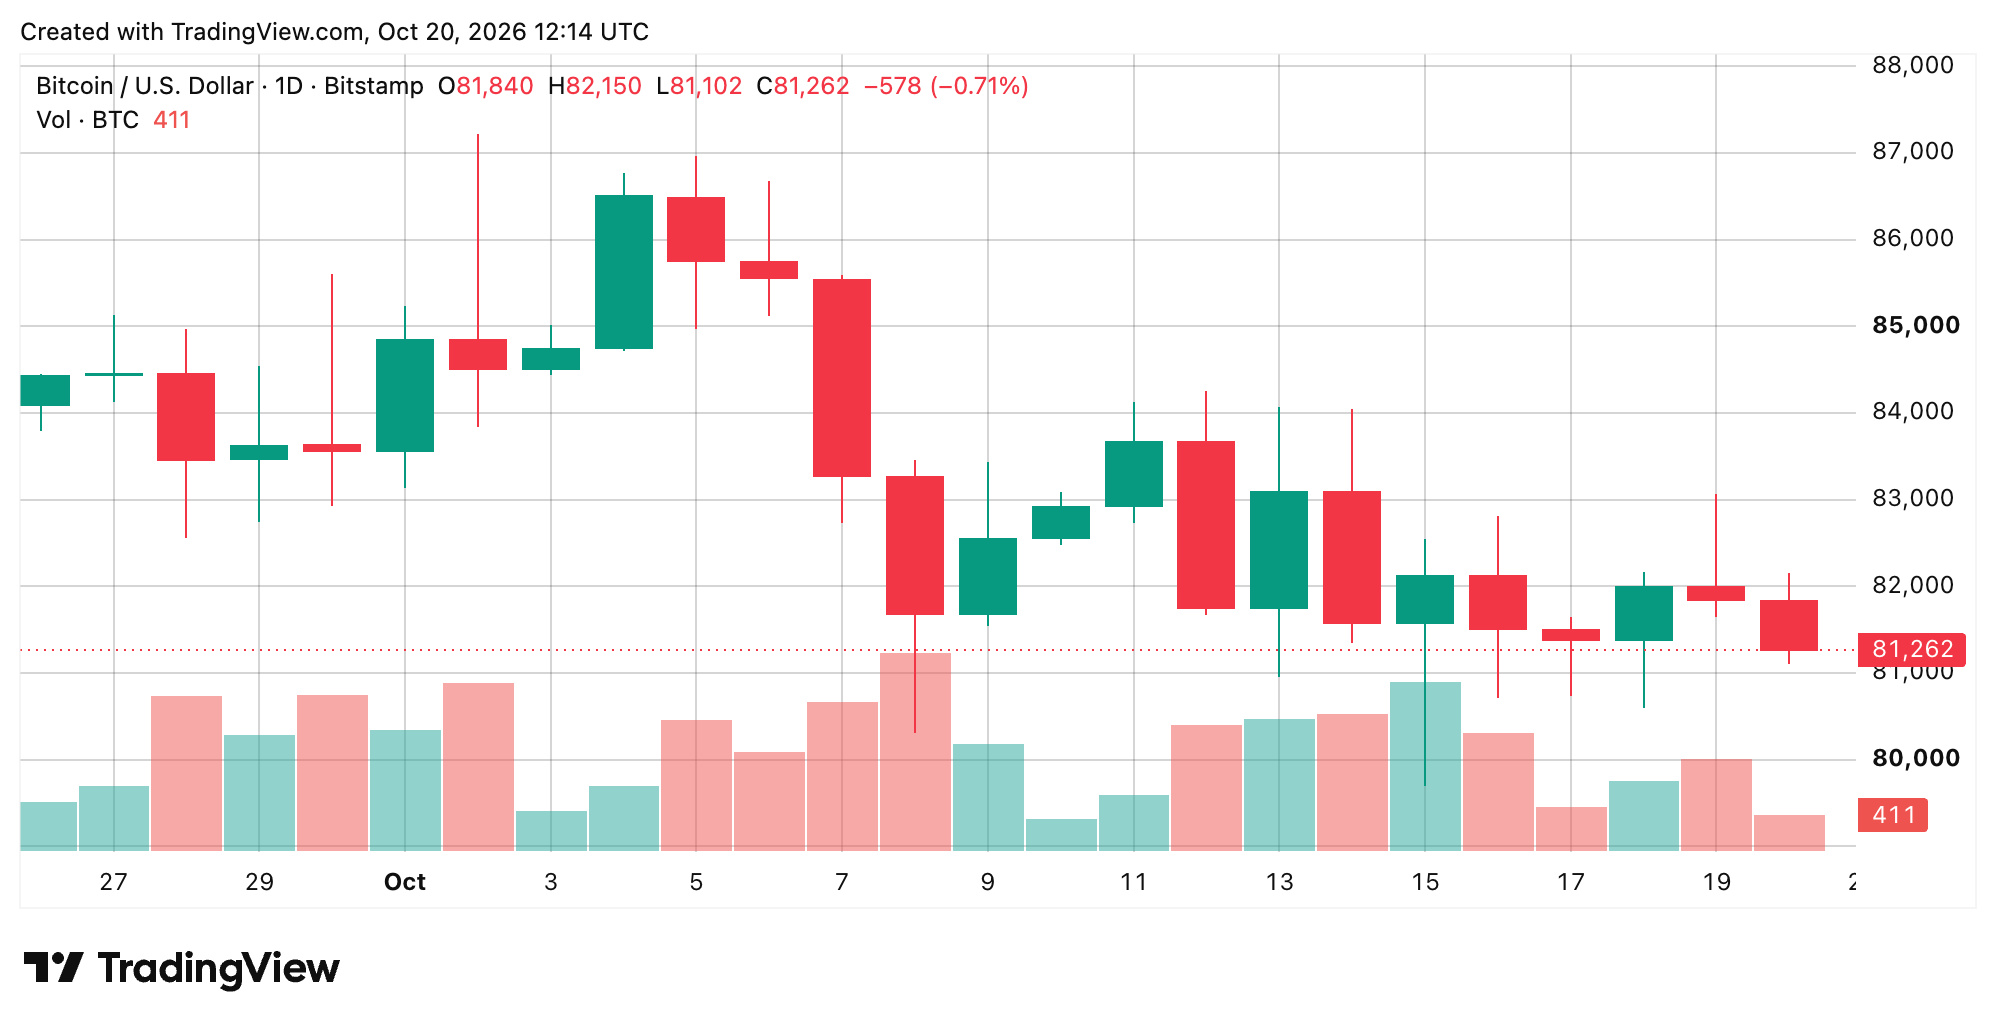
The $81,000 region has become increasingly consequential as buyers attempt to preserve the market’s remaining technical support, leaving little room for another unsuccessful recovery attempt.
Oscillators Show Sellers Have the Advantage
The oscillator readings reinforce the cautious outlook without establishing an outright capitulation scenario. The relative strength index (RSI) stands at 46.24, while the Stochastic registers 30.61, both classified as neutral on Tuesday. The commodity channel index (CCI) sits at negative 78.90, and the average directional index (ADX) reads 20.07 with a bearish designation.
More concerning are momentum at negative 1,515.88 and moving average convergence divergence (MACD) at negative 82.32, both signaling weakness after some bouts with the bears. The Awesome oscillator (AO) remains negative at 1,446.45, while the Stochastic relative strength index (RSI) fast reading of 9.19 points to depressed short-term momentum.
Moving Averages Preserve a Longer-Term Bullish Counterargument
Moving averages (MAs) expose bitcoin’s technical contradiction. The 10-period exponential moving average (EMA) at $82,061 and 20-period exponential moving average (EMA) at $82,393 remain overhead, alongside the 20-period simple moving average (SMA) at $83,137.
Yet the 50-period exponential moving average (EMA) at $80,568, 100-period exponential moving average (EMA) at $77,149 and 200-period exponential moving average (EMA) at $75,983 retain bullish classifications. The 50-period simple moving average (SMA) at $81,538 adds another nearby obstacle, reinforcing the importance of reclaiming the $82,000 region before buyers can mount a more convincing recovery.
Bitfire Research Warns Inflation and Weak Demand Threaten Bitcoin’s Recovery
In a note shared with Bitcoin.com News Tuesday morning, Bitfire Research sees mounting macroeconomic pressure complicating bitcoin’s recovery. The firm points to September’s hotter-than-expected inflation figures, including a 3.7% annual increase in consumer prices, alongside a roughly 90% probability of a December Federal Reserve rate hike. U.S. spot bitcoin exchange-traded funds (ETFs) also recorded approximately $228 million in weekly net outflows, while a negative Coinbase premium suggests weakening domestic demand.
In its analysis, Bitfire cautions that:
“Continued ETF outflows, a negative Coinbase premium and weak technical indicators suggest that spot demand has yet to recover decisively.”
From a technical perspective, Bitfire identifies $82,500 as a significant resistance barrier, followed by the 20-day Bollinger Bands midpoint near $83,300. The researchers place critical downside support around $79,800, with the lower Bollinger Band near $80,200 and the 14-day relative strength index (RSI) hovering around 30.
“Unless bulls reclaim the mid-band quickly, bitcoin may retest lower-band support in the short term,” Bitfire’s assessment warns. With the Federal Reserve’s Oct. 28 policy decision approaching, the research firm sees limited room for complacency as bitcoin struggles to establish a convincing recovery.
| 🟢 Bull Verdict | 🔴 Bear Verdict |
|---|---|
| Bitcoin reclaiming $82,000 and breaking convincingly above $82,500 would strengthen the recovery argument, opening a potential advance toward $83,060 and eventually $84,000. Sustained trading above these barriers, supported by improving momentum and stronger participation, would begin challenging the bearish short-term structure. | A decisive breakdown beneath $81,100 would expose $80,500, followed by $80,000 and the $79,694 to $79,800 support region. Failure to defend that area would reinforce the bearish technical outlook, particularly if ETF outflows persist and macroeconomic conditions continue to discourage risk-taking. |