
Bitcoin has fallen from near $80,000 into the $73,000–$74,000 range over the past week through Nov. 11, leaving traders weighing a possible rebound toward $77,500 against an analyst’s warning of a deeper decline to $65,000.
Summary
- Bitcoin’s weekly heatmap shows heavy overhead liquidation concentrations between roughly $76,000 and $77,500.
- Tranquility Crypto sees a possible $65,000 move after a descending-channel breakdown.
- U.S. spot Bitcoin ETFs lost $1.28 billion during the Nov. 2–6 trading week.
- October consumer prices rose 0.4%, while core inflation held at 0.3%.
CoinGlass’s one-week liquidation heatmap shows Bitcoin spending much of the period below its earlier trading range, with successive rebounds failing to recover the ground lost during the initial sell-off. By the right-hand edge of the Nov. 11 snapshot, BTC was trading near $73,500.
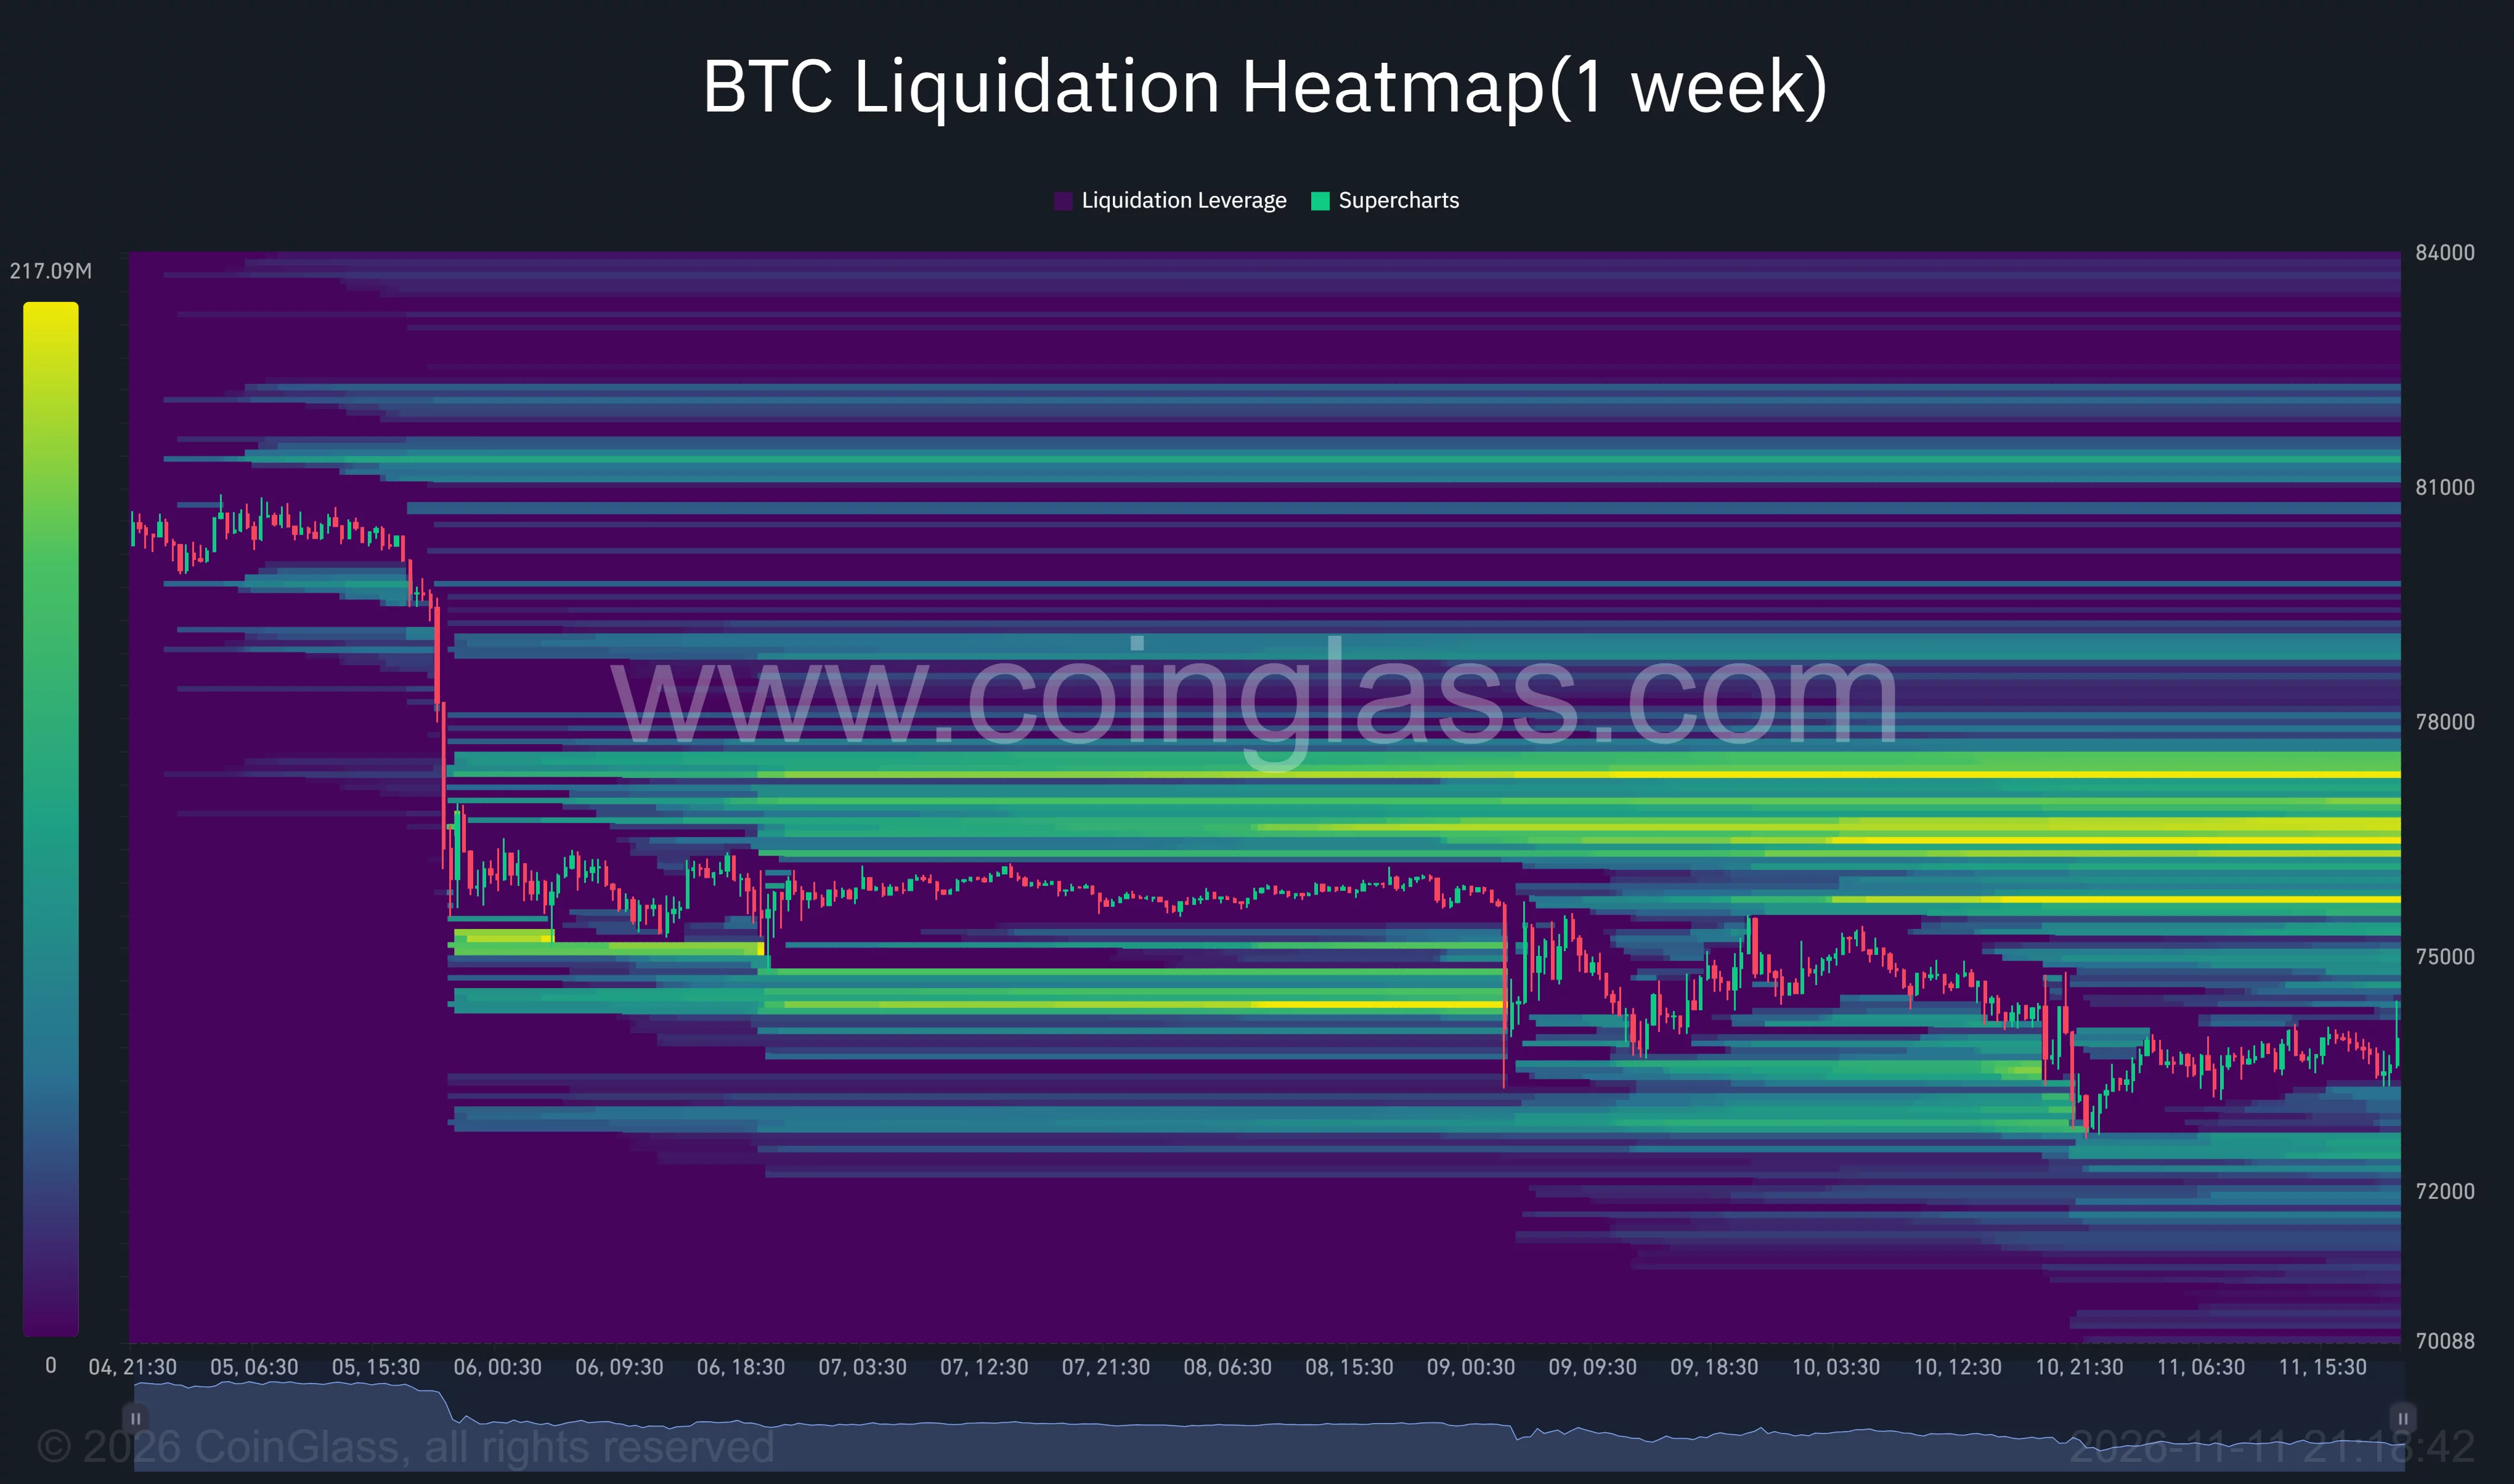
The chart records a steep fall around Nov. 5, followed by several days around $75,500–$76,000 before another decline. The latest candles remain below $75,000, a level buyers had been defending earlier in the week.
Bitcoin’s channel breakdown puts $65,000 in view
In a Nov. 11 X post, pseudonymous analyst Tranquility Crypto, who uses the handle @MstrTranquility, said Bitcoin had traded inside a descending channel since September. Their chart shows repeated rejections along the upper boundary before price slips beneath the lower trendline.
The analyst described an “expected move coming towards $65K,” while making a recovery of the broken structure a condition for becoming more comfortable calling a bottom.
From a reference price of $73,500, a decline to $65,000 would represent a further loss of approximately 11.6%. The target is the analyst’s projected scenario; the screenshot shows the start of a possible breakdown, with the projected move drawn beneath the latest candles.
Earlier technical coverage on Nov. 6 placed Bitcoin near $75,799, with its daily relative strength index at 37.82. The weekly candle had reached $81,196 before retreating, while the daily price remained below its middle Bollinger band near $79,759.
The latest heatmap shows price below that Nov. 6 snapshot, with the intervening rebounds failing to carry Bitcoin back toward $80,000.
Liquidation clusters leave room for a $77,500 rebound
A different setup appears above the market. In a Nov. 11 X post, analyst Ted Pillows identified a large short-side liquidity cluster between $76,000 and $77,500.
He suggested Bitcoin could rally toward the area if the stock market developed stronger upward momentum. His accompanying heatmap highlights the overhead concentration, while the supplied one-week CoinGlass chart shows bright bands across roughly the same region.
Measured from $73,500, reaching $76,000 would require a gain of 3.4%, while $77,500 would require approximately 5.4%. Both levels remain below the prices Bitcoin traded near at the beginning of the weekly chart.
Further overhead concentrations appear around $79,000 and above $81,000. Below the latest price, the map shows smaller bands around $72,000–$73,000, following the previous session’s move into that area.
U.S. ETF withdrawals persist despite slower daily selling
As crypto.news previously reported, weekly withdrawals from U.S. spot Bitcoin ETFs reached approximately $1.28 billion during Nov. 2–6. BlackRock’s IBIT accounted for $1.21 billion, while Fidelity’s FBTC attracted $93.1 million.
Farside Investors recorded another $201 million leaving the products on Nov. 9 and $95 million on Nov. 10. Together, those two sessions brought withdrawals to $296 million, although Tuesday’s total was less than half Monday’s.
Tuesday’s net withdrawal was approximately 52.7% smaller than Monday’s, based on Farside’s totals. Both sessions nevertheless ended negative, following withdrawals of $430.2 million on Nov. 5 and $411.9 million on Nov. 6.
IBIT lost $78.2 million on Tuesday, while FBTC shed $36.8 million. Morgan Stanley’s MSBT received $20 million, partially offsetting those withdrawals. Across Nov. 2–10, the daily category totals sum to approximately $1.58 billion in net outflows.
October inflation adds pressure after the earlier sell-off
The Bureau of Labor Statistics reported on Nov. 10 that October consumer prices rose 0.4%, following September’s 0.6% gain. Core prices, excluding food and energy, rose 0.3% for a third consecutive month.
Shelter costs rose 0.3%, accounting for more than 30% of the monthly headline gain. Food prices climbed 0.5%, and energy rose 0.7% after September’s 5.2% jump.
The release followed the initial decline visible on the weekly heatmap. Subsequent market coverage reported $723.37 million in crypto liquidations over its 24-hour measurement window, including roughly $570 million in longs, citing CoinGlass.
Bitcoin accounted for approximately $203 million of the reported liquidations, comprising $175 million in long positions and $28 million in shorts.
Disclosure: This article does not represent investment advice. The content and materials featured on this page are for educational purposes only.