
Solana price managed to hold above the $70 support on Thursday as bulls stepped in to defend the psychological level.
Summary
- Solana price dropped nearly 9% after a $270 million exploit on Drift and a sharp decline in network TVL.
- Broader risk-off sentiment driven by escalating Middle East tensions and rising oil prices added pressure on the token.
- Technical indicators show weakening momentum despite a potential falling wedge breakout, with bears still dominating trend strength.
According to data from crypto.news, Solana (SOL) price fell nearly 9% from an intraday high of $85.1 on Wednesday to an intraday low of $77.6 on Tuesday before stabilizing at $80 at press time.
Solana price fell following a $285 million exploit that occurred yesterday on Drift Protocol, a trading venue native to the Solana blockchain. Following the breach, the total value locked on Solana has shrunk by nearly $1 billion since the incident, per DeFiLlama.
The token also fell amid tensions in the Middle East that continued to drive investor sentiment away from risk assets. Notably, Iranian officials noted they would be targeting retaliatory measures against 18 U.S. military assets, including strategic bases in the region. On the other hand, the U.S. struck several key targets, including a critical supply bridge and logistics hubs.
The resulting conflict has fueled expectations that the Strait of Hormuz would continue to remain closed as the U.S. focuses its attention on bringing the regional threat to a standstill over the coming 2 to 3 weeks. Oil prices rose back above $110 amid fears of runaway inflation and supply chain disruptions.
On the daily chart, Solana price is close to breaking out of a multi-month falling wedge pattern formed of two descending and converging trendlines. A breakout from a falling wedge pattern often signals a powerful bullish reversal as selling pressure finally exhausts itself.
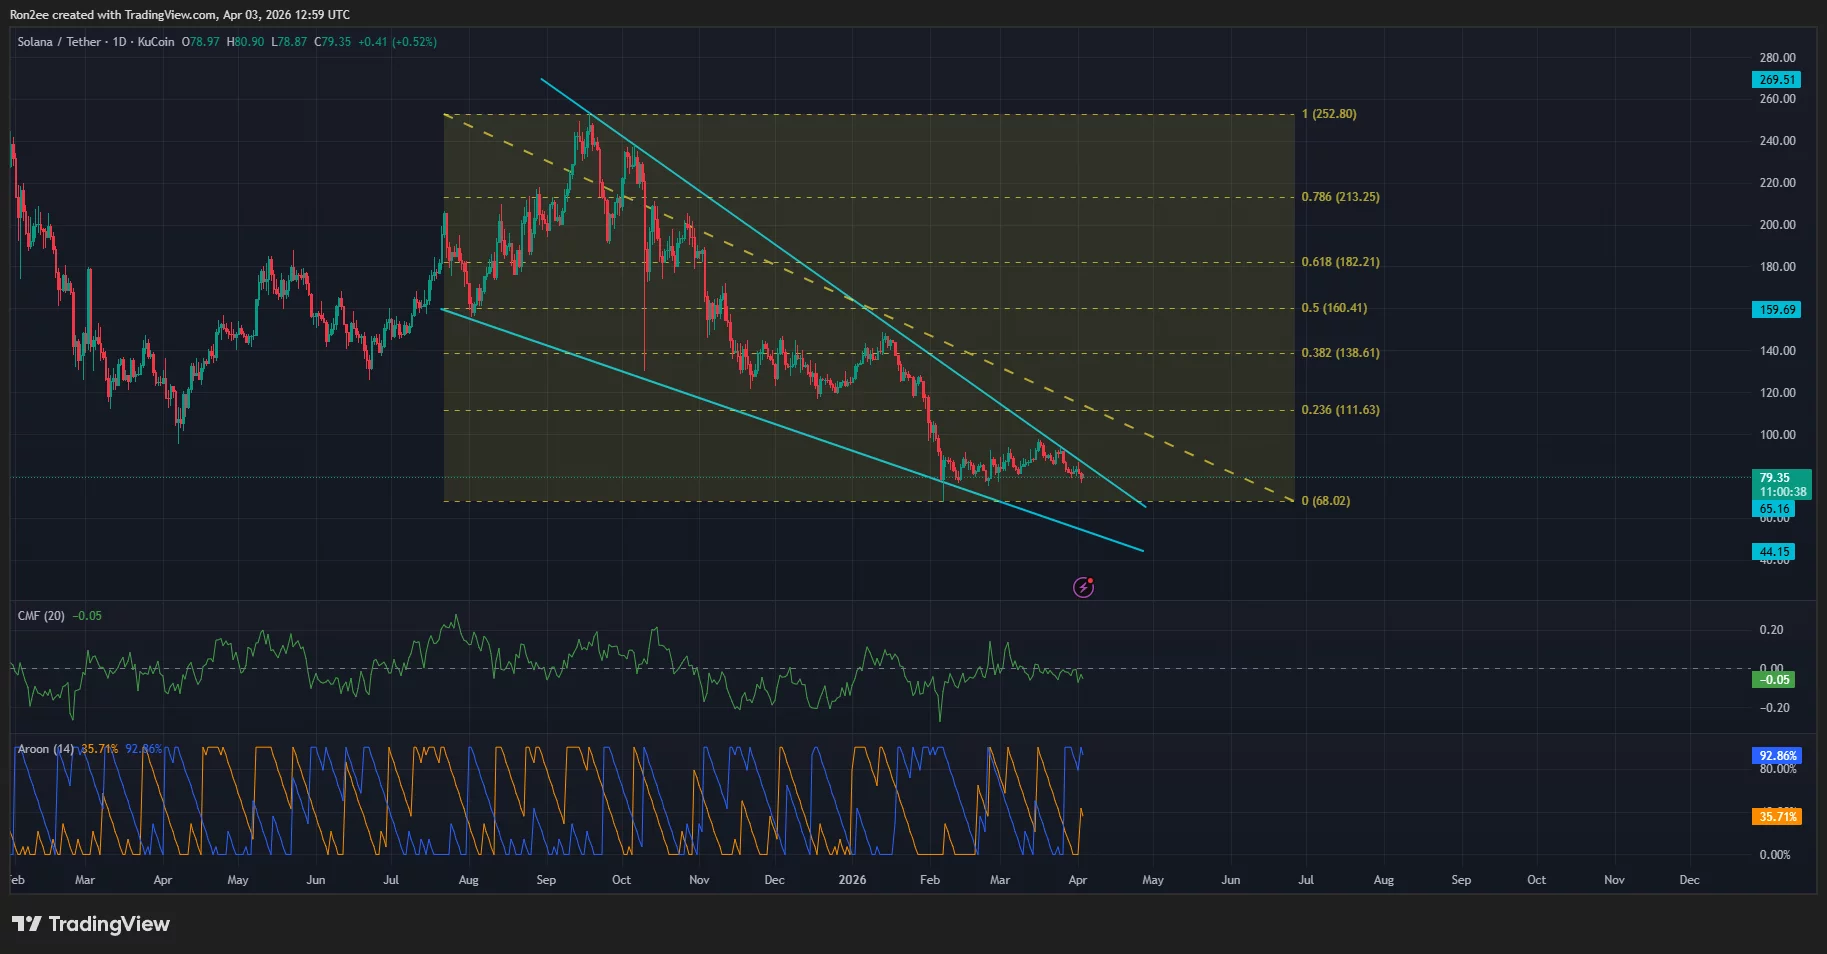
For Solana, a confirmed breakout from such a pattern could fling the price all the way to $111, which aligns with the 23.6% Fibonacci retracement level. Reaching this target would represent a significant recovery from recent lows and could reignite broader investor interest in the ecosystem.
However, current technical data suggests some caution on the way. Notably, the Chaikin Money Flow index showed a negative reading of -0.05. A negative reading on the indicator suggests that there is still a lack of strong buying pressure and that some capital is still flowing out of the asset.
At the same time, the Aroon Down stood at 92.86% while the Aroon Up was at 35.71%, which means the bears still hold the upper hand in terms of trend strength. This disparity indicates that while a breakout is possible, the downward momentum has not yet been fully broken by the bulls.
Disclosure: This article does not represent investment advice. The content and materials featured on this page are for educational purposes only.
