
It appears the moment has finally arrived. Ethereum is closing in on a new all-time high after nearly four years. With this momentum, many investors are eyeing the $5,000 mark as a realistic target in the weeks ahead.
Technical Analysis
By ShayanMarkets
The Daily Chart
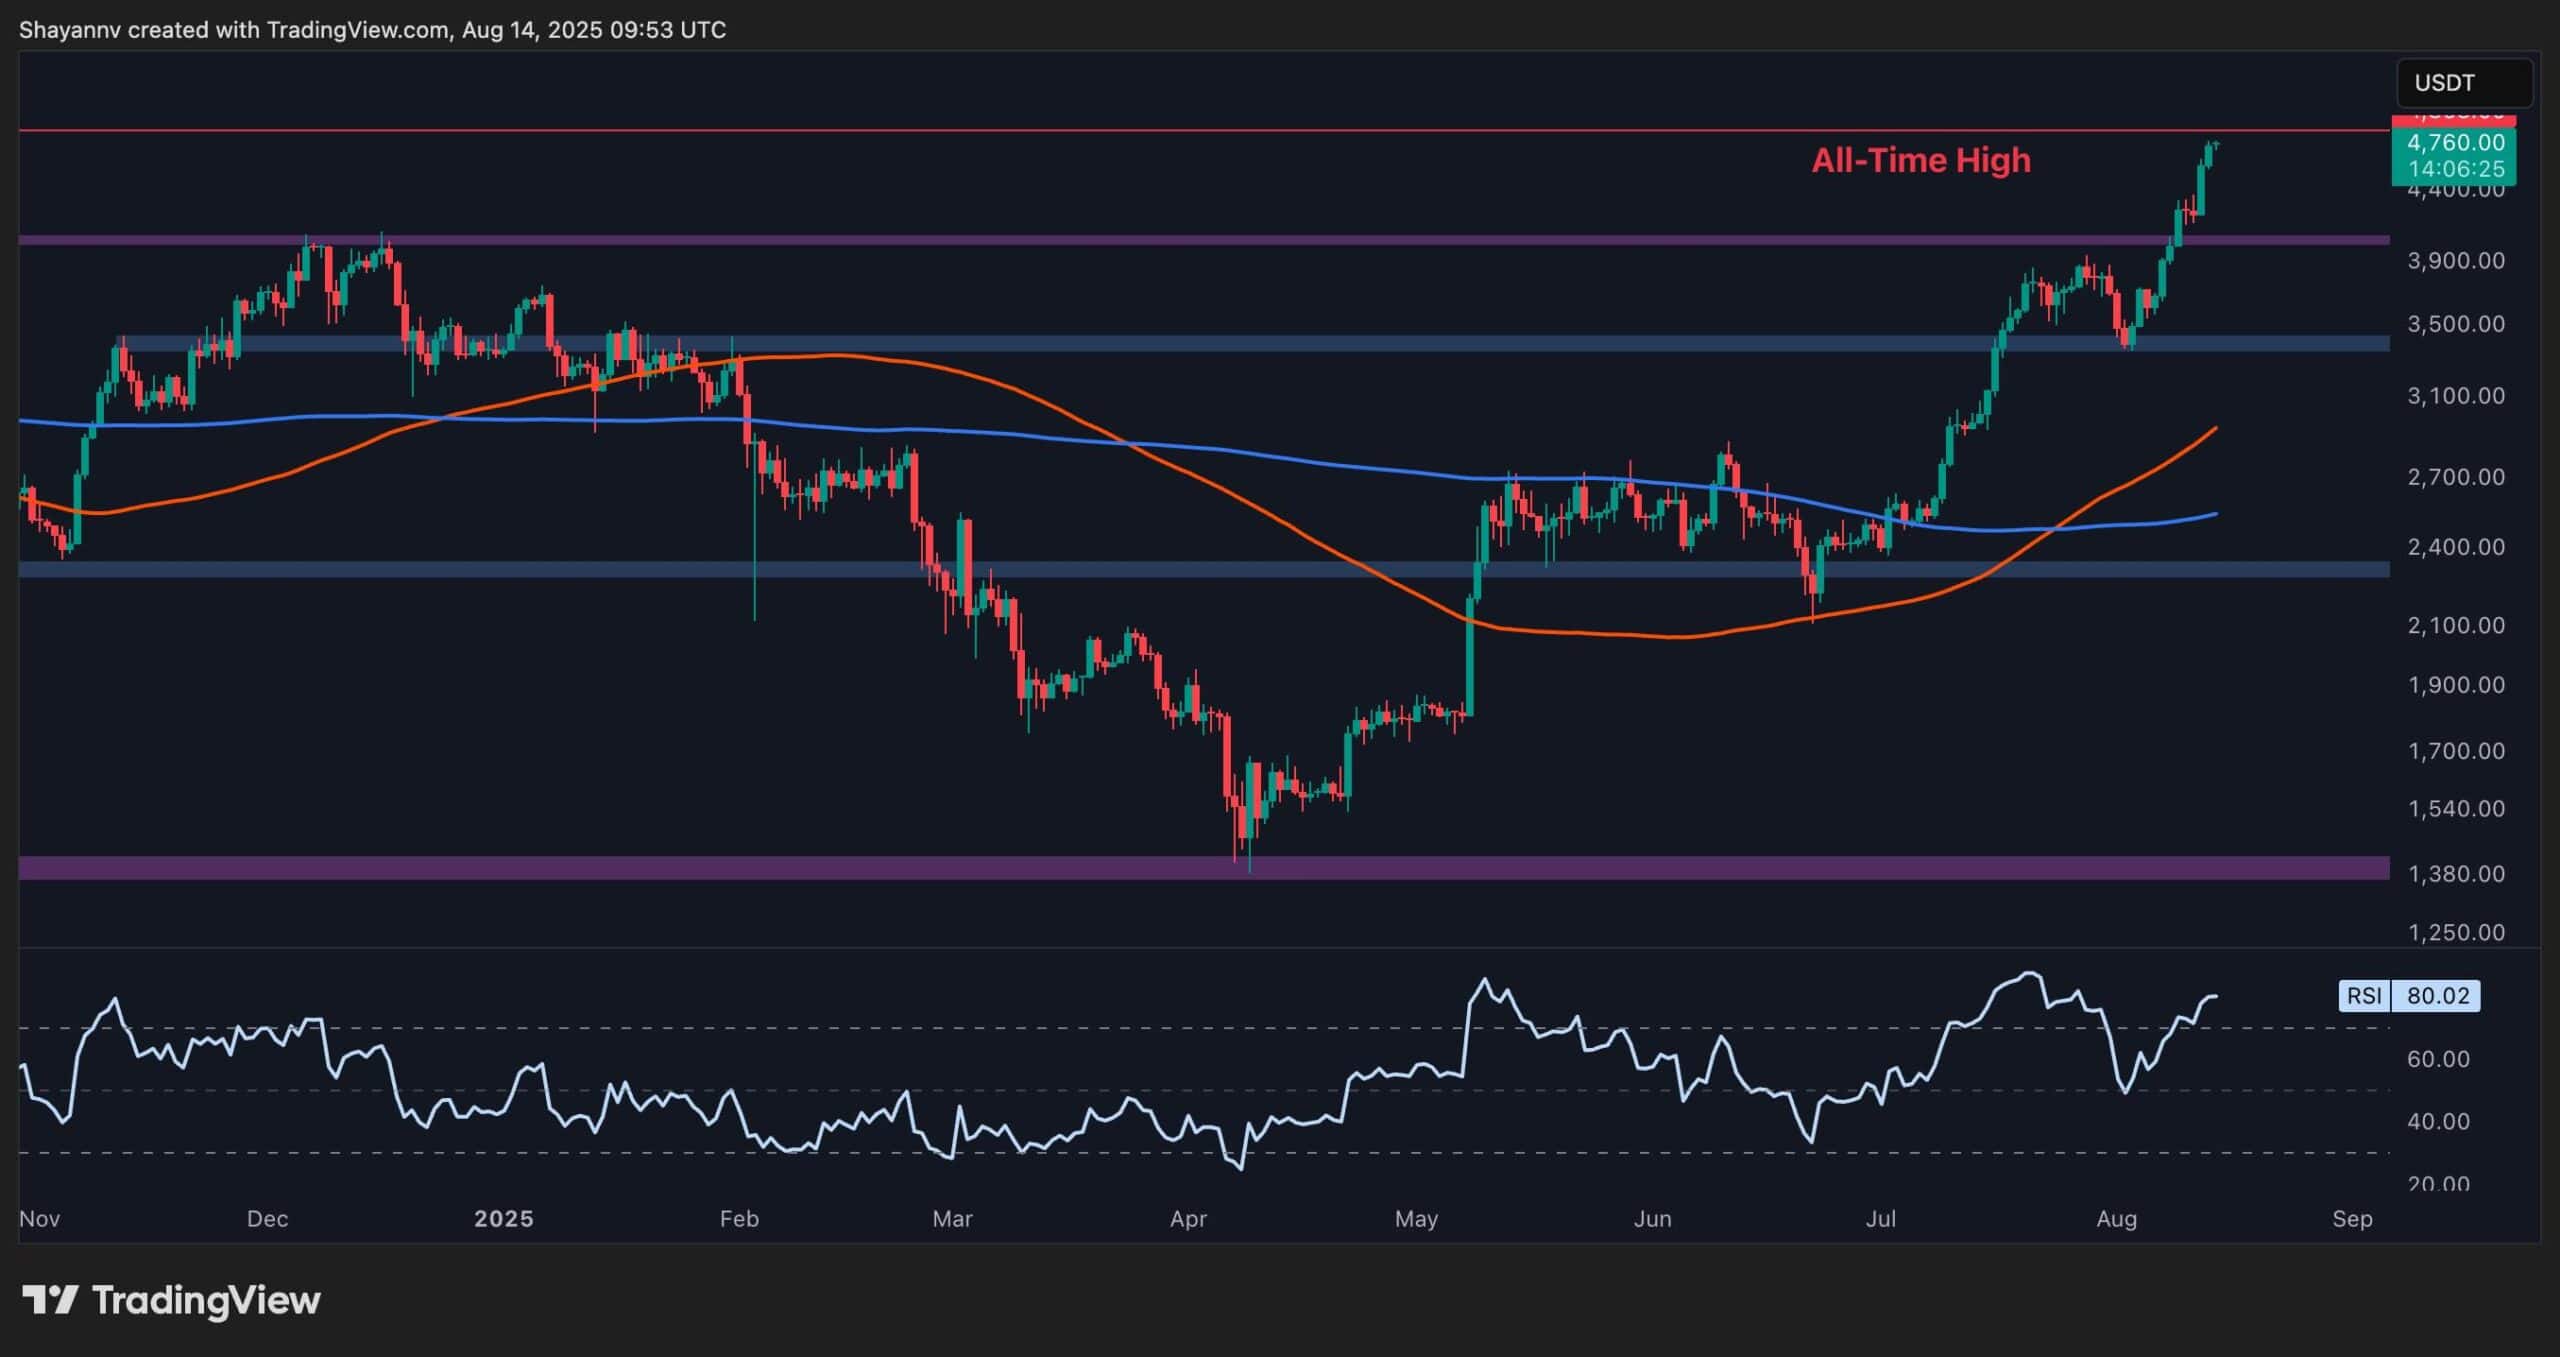
On the daily chart, it’s clear that since ETH’s rebound from the 100-day moving average near the $2,100 mark in June, the price has been on a steady upward trajectory. Now, Ethereum is rallying almost vertically, closing in on a new all-time high. With the current momentum, even the $5,000 psychological level appears within reach. Furthermore, the $4,000 level can now be seen as a strong support zone, adding to the confidence of bullish traders.
That said, momentum indicators such as the RSI are signaling a potential overbought condition, suggesting the possibility of a consolidation or pullback before ETH can push higher. However, the recent bullish crossover between the 100-day and 200-day moving averages, with the 100-day MA rising sharply in line with price action, indicates strong market optimism. This setup suggests that any pullback could be temporary, keeping the broader uptrend intact.
The 4-Hour Chart
Looking at the 4-hour chart, ETH has been consistently moving within a broad ascending channel for the past few months. This formation has carried the asset through several resistance zones, all of which have now flipped into support. With the channel’s upper boundary already sitting above the previous $4,800 all-time high, the path toward testing the $5,000 level in the near term appears clear.
On the flip side, the RSI indicator on this timeframe is clearly in overbought territory, similar to the daily chart, and the recent 4-hour candles have been shrinking in size. As a result, some analysts anticipate a pullback soon. Still, given the strong market structure and momentum, a sharp breakout beyond the $4,800 all-time high seems more likely to play out before any notable correction sets in.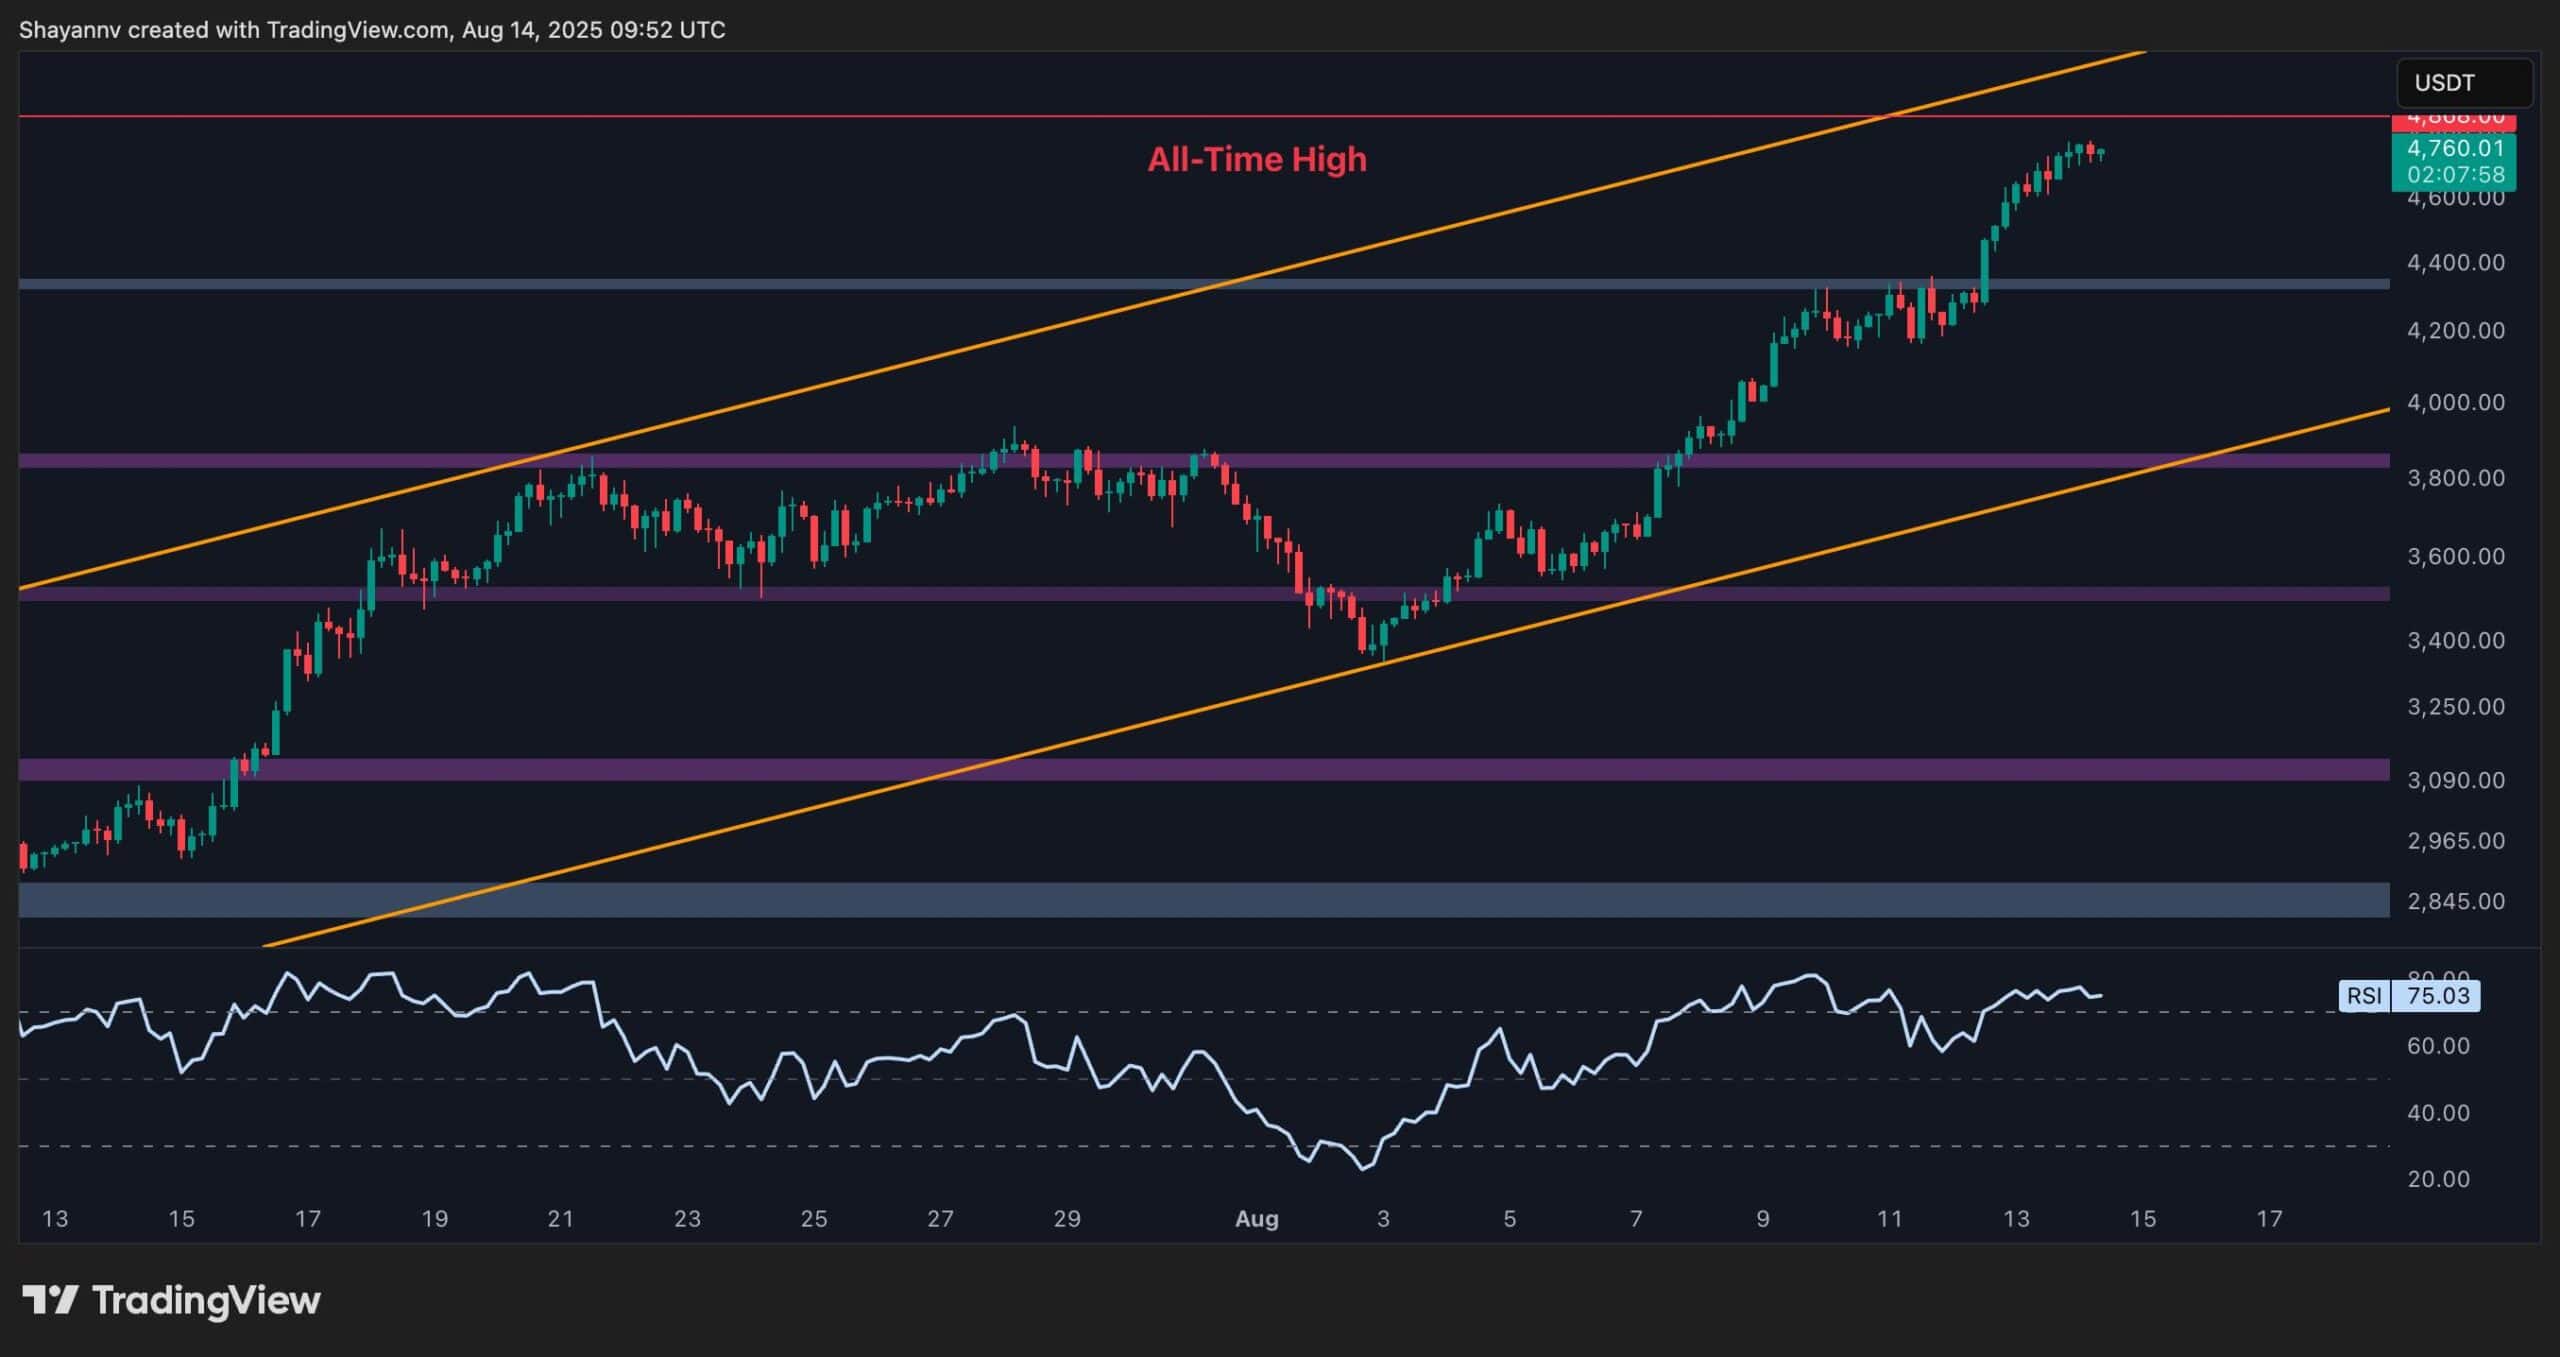
Sentiment Analysis
Exchange Reserve
The chart shows Ethereum’s price movement alongside its exchange reserve across all exchanges. Over the last two years, exchange reserves have been in a consistent downtrend, dropping from above 28 million ETH in early 2022 to around 18.6 million today.
This significant decline suggests that a large portion of ETH has been moving off exchanges, likely into cold storage or staking. Historically, such supply reduction on exchanges tends to tighten available liquidity, creating favorable conditions for upward price pressure, especially during strong bullish phases.
The recent surge to around $4,700, just shy of the $4,800 all-time high, aligns with this supply squeeze narrative. If the decline in exchange reserves continues, ETH will likely rally even higher in the coming months.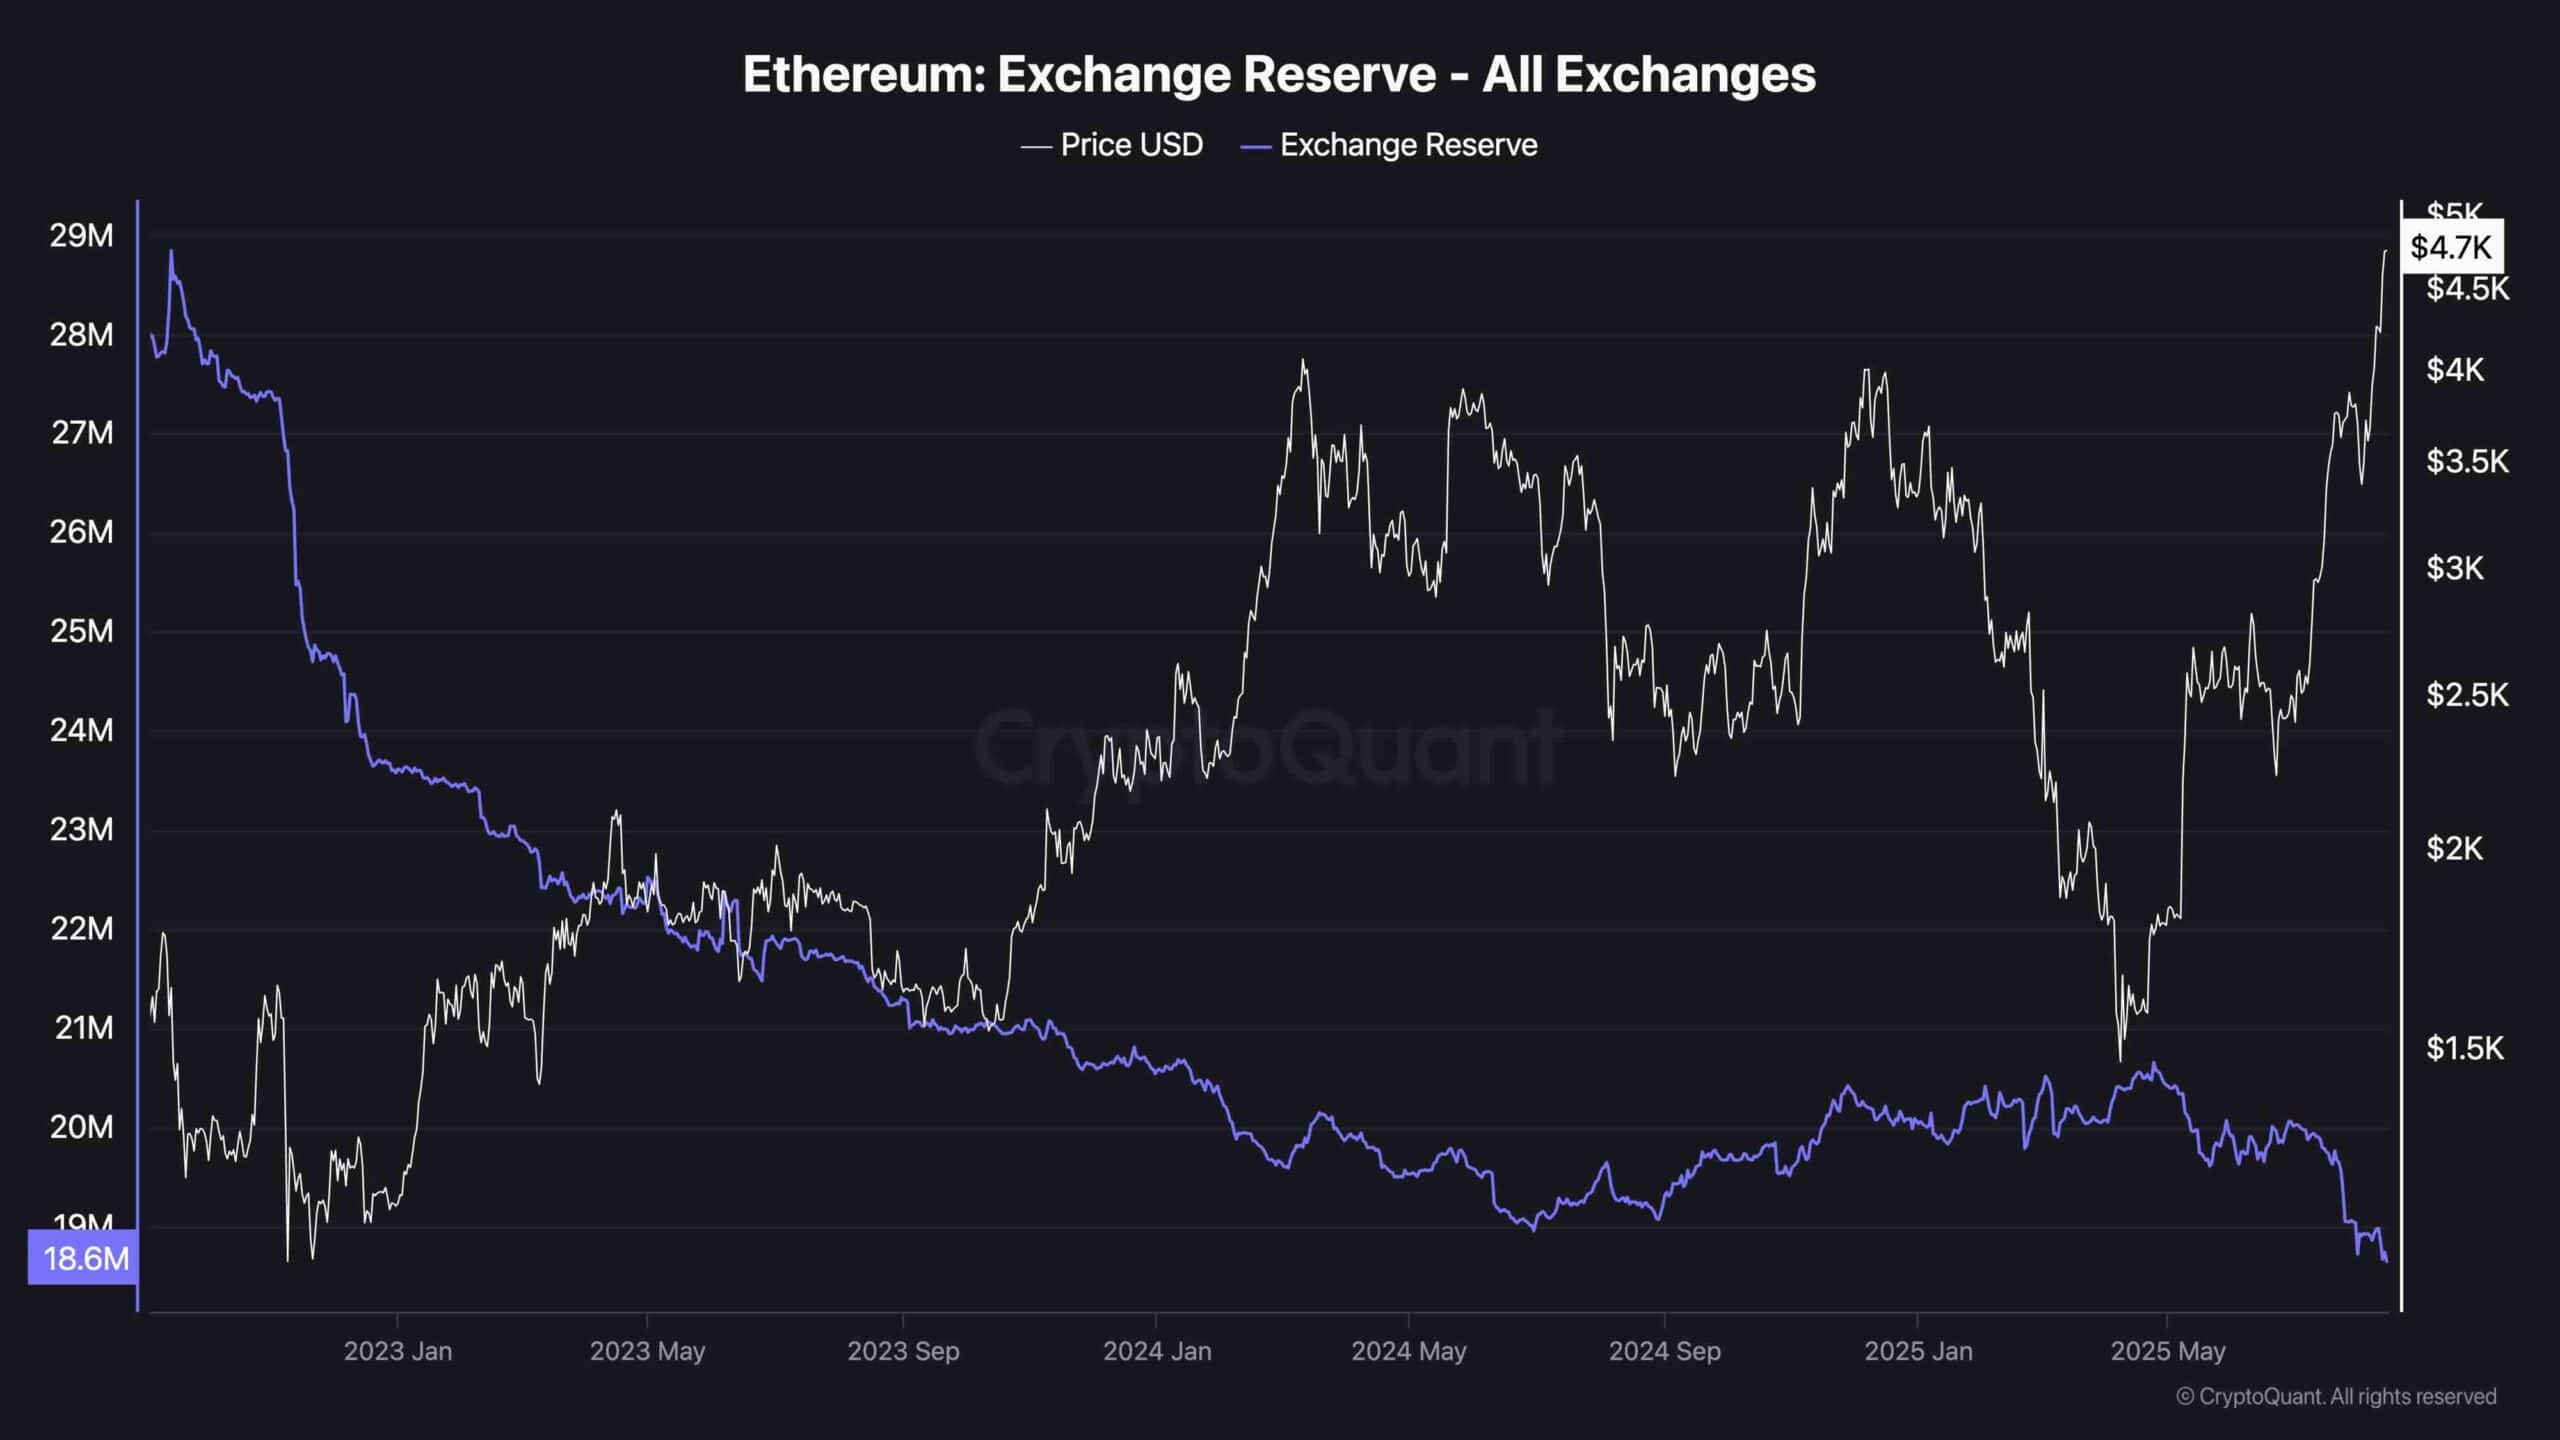
Binance Free $600 (CryptoPotato Exclusive): Use this link to register a new account and receive $600 exclusive welcome offer on Binance (full details).
LIMITED OFFER for CryptoPotato readers at Bybit: Use this link to register and open a $500 FREE position on any coin!
Disclaimer: Information found on CryptoPotato is those of writers quoted. It does not represent the opinions of CryptoPotato on whether to buy, sell, or hold any investments. You are advised to conduct your own research before making any investment decisions. Use provided information at your own risk. See Disclaimer for more information.
Cryptocurrency charts by TradingView.
