
Bitcoin slipped below $64,000 on Aug. 11 as traders cut risk ahead of fresh U.S. inflation data and rising oil prices revived concerns about the Federal Reserve’s rate path.
Summary
- Bitcoin traded near $63,855, down 1.6%, after failing to establish support above $65,000 this week.
- Ether fell 2.2% and XRP lost 2.1%, while Hyperliquid and Chainlink advanced against broader weakness.
- U.S. spot Bitcoin ETFs recorded $144.6 million in net outflows Monday after five inflow sessions.
- Brent crude held near $88 as stalled U.S. Iran talks renewed inflation concerns before CPI.
- July CPI is scheduled Wednesday at 8:30 a.m. ET, leaving crypto exposed to macro volatility.
BTC traded near $63,855 at the time of writing, down about 1.6% over 24 hours after making several unsuccessful attempts to establish support above $65,000.
The pullback follows a short recovery that took Bitcoin above $65,300 on Monday. As covered in Monday’s CPI preview, weaker U.S. employment data had previously helped BTC recover as traders reduced expectations for tighter monetary policy. The focus has now shifted to inflation and energy prices.
Bitcoin has tested the $65,000 area for four consecutive days without sustaining a move above it. Downside levels remain relevant. Recent short term holder analysis placed the average acquisition price for newer holders at $67,523, meaning BTC remains below a level where some investors could seek to exit near breakeven. Support has recently formed around $63,000 to $64,000.
Ether and XRP lead losses as altcoins split
Large cap altcoins were mostly weaker alongside Bitcoin. Ether traded at about $1,871 at press time, down 2.8% over 24 hours. XRP traded near $1.00 after falling 3.1% and was down more than 6% over seven days. Solana declined about 1% to $75.78, while BNB slipped 1% to roughly $599.
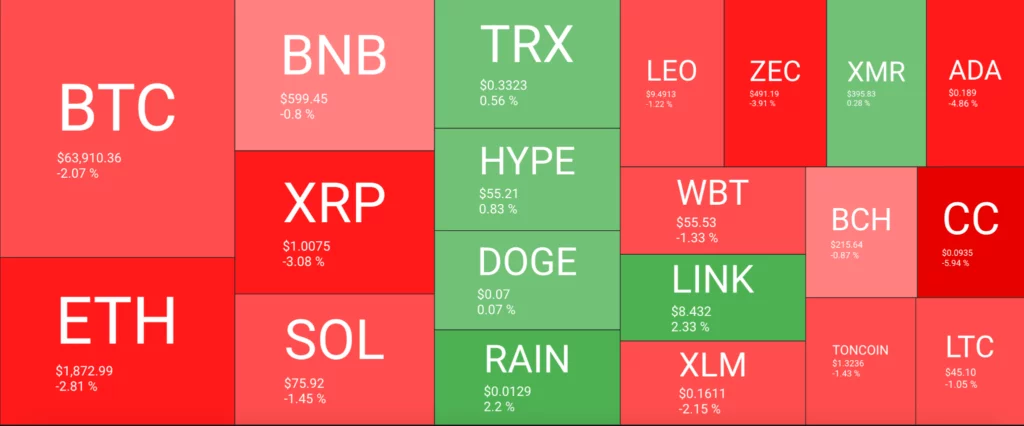
Performance was not uniformly negative. Hyperliquid rose about 2.4% to $55.25, Chainlink gained 2% to $8.43, TRX advanced 0.5% to $0.33 and Dogecoin added roughly 0.5% around $0.07. Among the top 100 assets shown, Internet Computer gained 8.3%, Lighter rose 7% and Mantle added 5.8%. Bitway fell 8.1%, Canton declined 6.5% and Cardano lost 4.8%.
The split suggests traders are still willing to take selective altcoin exposure despite weakness in Bitcoin, Ether and XRP. However, the broad market has yet to show the synchronized strength typically associated with a sustained risk rally.
U.S. CPI and oil become the next macro test
Oil has returned as a major U.S. macro risk. Brent crude held around $87.81 on Tuesday after gaining more than 5% in the previous session as hopes for an agreement between Washington and Tehran weakened. Negotiations over the Strait of Hormuz remain unsettled, keeping energy supply risks elevated. Reuters provided the latest report.
Higher energy prices can feed into inflation expectations and affect the outlook for U.S. interest rates. The Bureau of Labor Statistics schedule confirms that July CPI will be released Wednesday, Aug. 12, at 8:30 a.m. ET. The release gives traders a fresh reading on inflation after softer June data had eased some pressure on risk assets.
U.S. Treasury markets are already reflecting some of that caution. The benchmark 10 year yield rose toward 4.7% alongside oil on Monday. Higher yields generally raise the return available on lower risk assets, creating another hurdle for Bitcoin and other cryptocurrencies ahead of the CPI release.
What happens next for Bitcoin and ETF flows
Institutional flows offer a mixed signal. U.S. spot Bitcoin ETFs recorded five consecutive positive sessions from Aug. 3 through Aug. 7, attracting $865.3 million according to Farside Investors. That streak ended Monday with $144.6 million in net withdrawals, including $53.6 million from BlackRock’s IBIT and $52 million from Grayscale’s GBTC. Farside’s latest data replaces earlier provisional estimates of Monday’s outflow.
The strong preceding week was examined in recent ETF inflow coverage, although that report used SoSoValue figures and therefore produced a slightly different weekly total. Both datasets showed the same broad pattern: five positive sessions followed by renewed withdrawals on Monday.
Washington also remains part of the market backdrop. The Senate pushed its CLARITY Act vote into September after lawmakers failed to resolve disagreements before the August recess, as detailed in earlier CLARITY Act coverage. That removed an anticipated August policy event while leaving market structure legislation unresolved.
Wednesday’s CPI release is now the nearest fixed catalyst. Bitcoin first needs to reclaim $65,000 before the $67,500 to $70,000 region becomes relevant again.
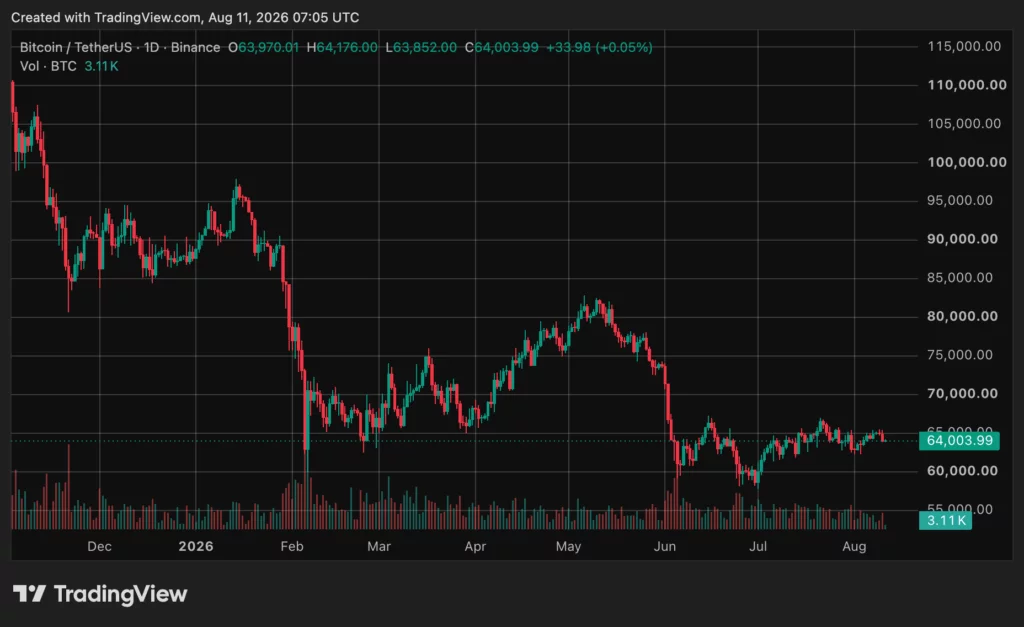
A move below the recent $63,000 area would instead put the market’s latest recovery under greater pressure. Neither direction has been confirmed, leaving inflation, Treasury yields and ETF flows as the clearest near term signals to watch.
Disclosure: This article does not represent investment advice. The content and materials featured on this page are for educational purposes only.