
Bitcoin price pulled back after briefly breaking above $82,000 on Sept. 4, as traders took profits following a short squeeze driven by softer Federal Reserve expectations and renewed demand for US spot Bitcoin ETFs.
Summary
- Bitcoin price retreated toward $81,150 after reaching an intraday high above $82,000.
- The 4-hour RSI reached 67.3, while the upper Bollinger Band stood near $82,034.
- US spot Bitcoin ETFs reportedly attracted $730.8 million in net inflows on Sept. 3.
- Liquidation clusters sit near $82,000 above price and between $79,800 and $80,300 below it.
Bitcoin price pulls back after testing $82,000
According to data from crypto.news, Bitcoin (BTC) price traded near $81,150 at the time of writing, having failed to hold an intraday move above the $82,000 psychological level. The pullback left the asset about 1% below its local high but still well above the $80,000 mark reclaimed during the previous session.
The rally accelerated after Bitcoin moved out of a range around $77,000–$79,000. Short sellers were forced to close leveraged positions as the price crossed $80,000, adding automatic buy orders to the market.
CoinGlass data cited by market reports showed that the broader crypto market recorded more than $500 million in liquidations during the rally, with short positions accounting for most of the total. Bitcoin shorts reportedly absorbed about $415 million of those losses.
Price action has since slowed near a technically important area. Galaxy Research data shared by analyst Quinten François placed Bitcoin’s 50-week moving average near $81,041, almost level with the current market price.
According to François, Bitcoin has not closed a weekly candle above that moving average since November 2025. He said a move through $82,800 would also produce the first higher high of the broader downtrend and bring $90,000 back into consideration.
Fed expectations and ETF inflows supported the rally
Bitcoin’s recovery followed a drop in expectations for another US interest-rate increase in September. Fed Governor Christopher Waller said policymakers could keep rates unchanged if incoming inflation data confirms that price pressures are cooling.
The probability of a September rate increase fell from about 63% to nearly 50% after Waller’s comments, according to CME FedWatch. Lower Treasury yields and a weaker dollar accompanied the shift, improving conditions for risk assets.
The move also followed softer US private employment figures. ADP reported weaker job growth than economists expected, adding to the view that the Fed may have less room to tighten monetary policy further.
US-listed spot Bitcoin ETFs provided another source of demand. François, citing Galaxy Research data, said the products recorded $730.8 million in combined net inflows on Sept. 3. The figure marked a sharp improvement from the mixed flows recorded at the beginning of the month.
US investors will now focus on the August employment report and upcoming inflation readings. Waller has not ruled out a hike, meaning stronger inflation data could reverse part of the market’s recent repricing.
Bitcoin technical indicators favor buyers above $78,000
The daily chart shows that Bitcoin has recovered above its major moving averages. The 20-day simple moving average stands near $75,700, while the 50-day and 100-day averages sit at approximately $68,845 and $66,405, respectively.
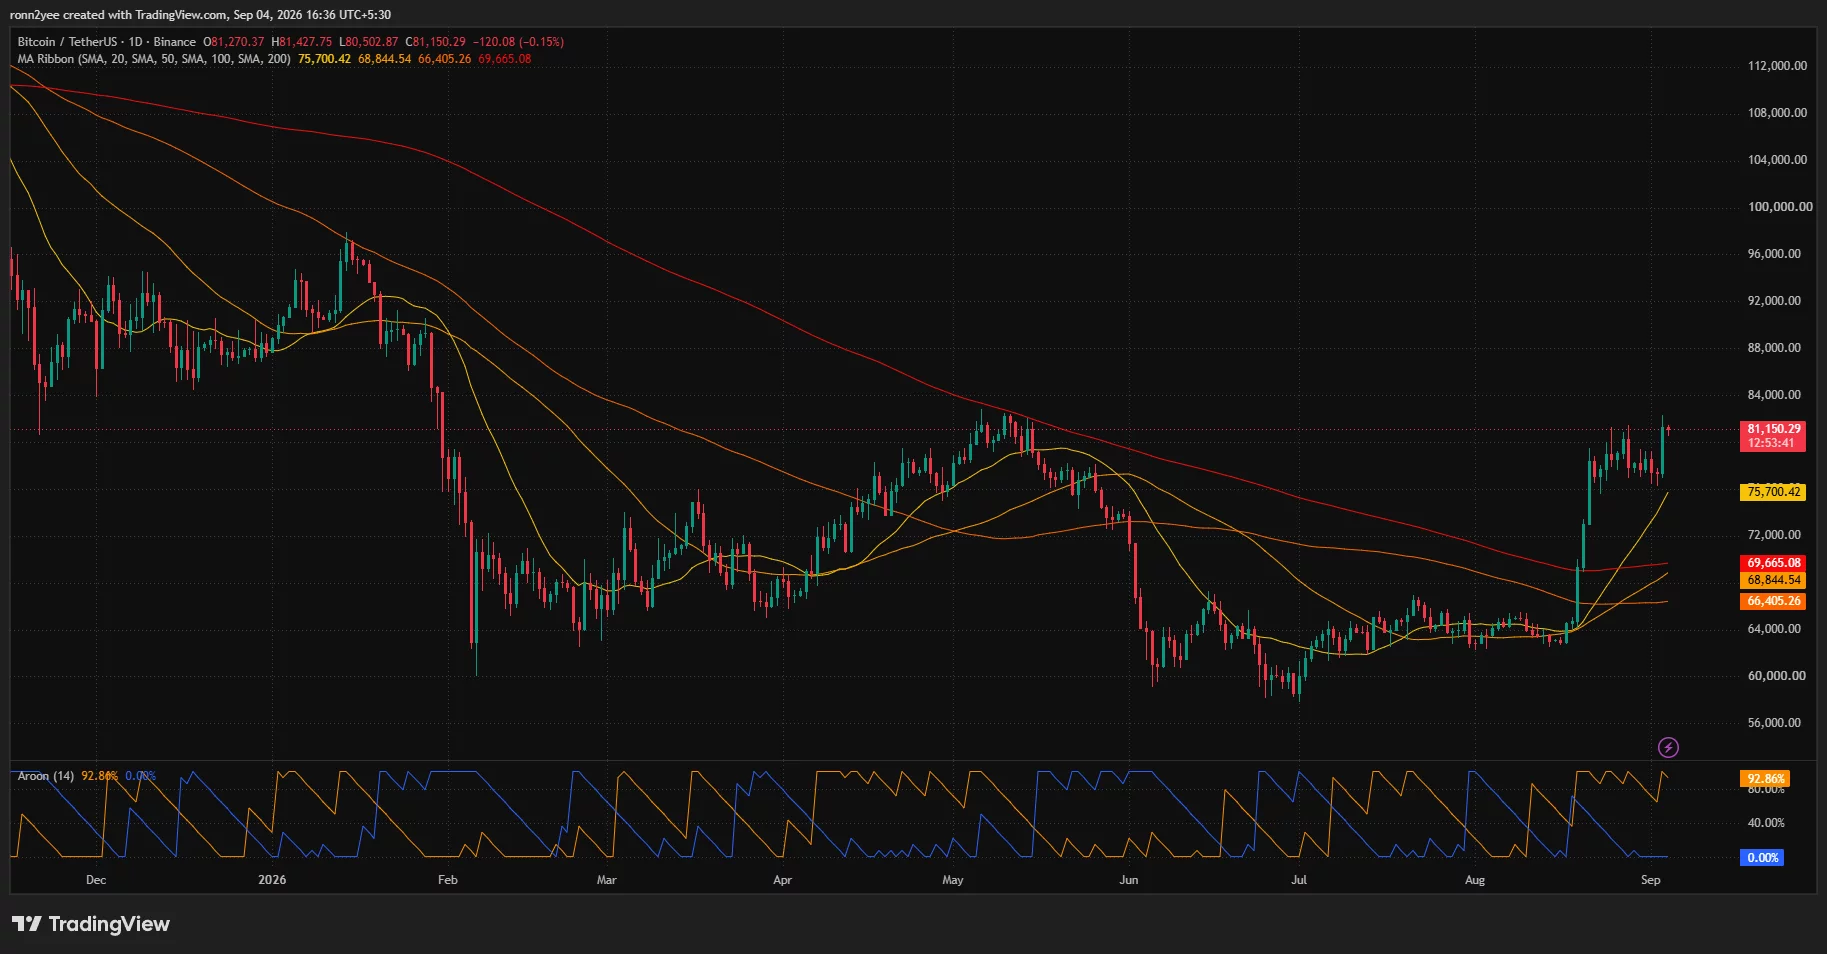
Bitcoin is also above its 200-day moving average near $69,665. The separation between price and the shorter moving averages reflects the strength of the rebound, but it also leaves room for a larger correction if buyers fail to defend the breakout.
The daily Aroon Up reading reached 92.86%, while Aroon Down fell to zero. The indicator shows that a recent high occurred much more recently than a fresh low, supporting the current bullish trend.
Shorter-term readings are less decisive. On the 4-hour chart, Bitcoin is trading close to the upper Bollinger Band at $82,034. The middle band near $78,678 acts as the first mean-reversion target, while the lower band stands around $75,321.
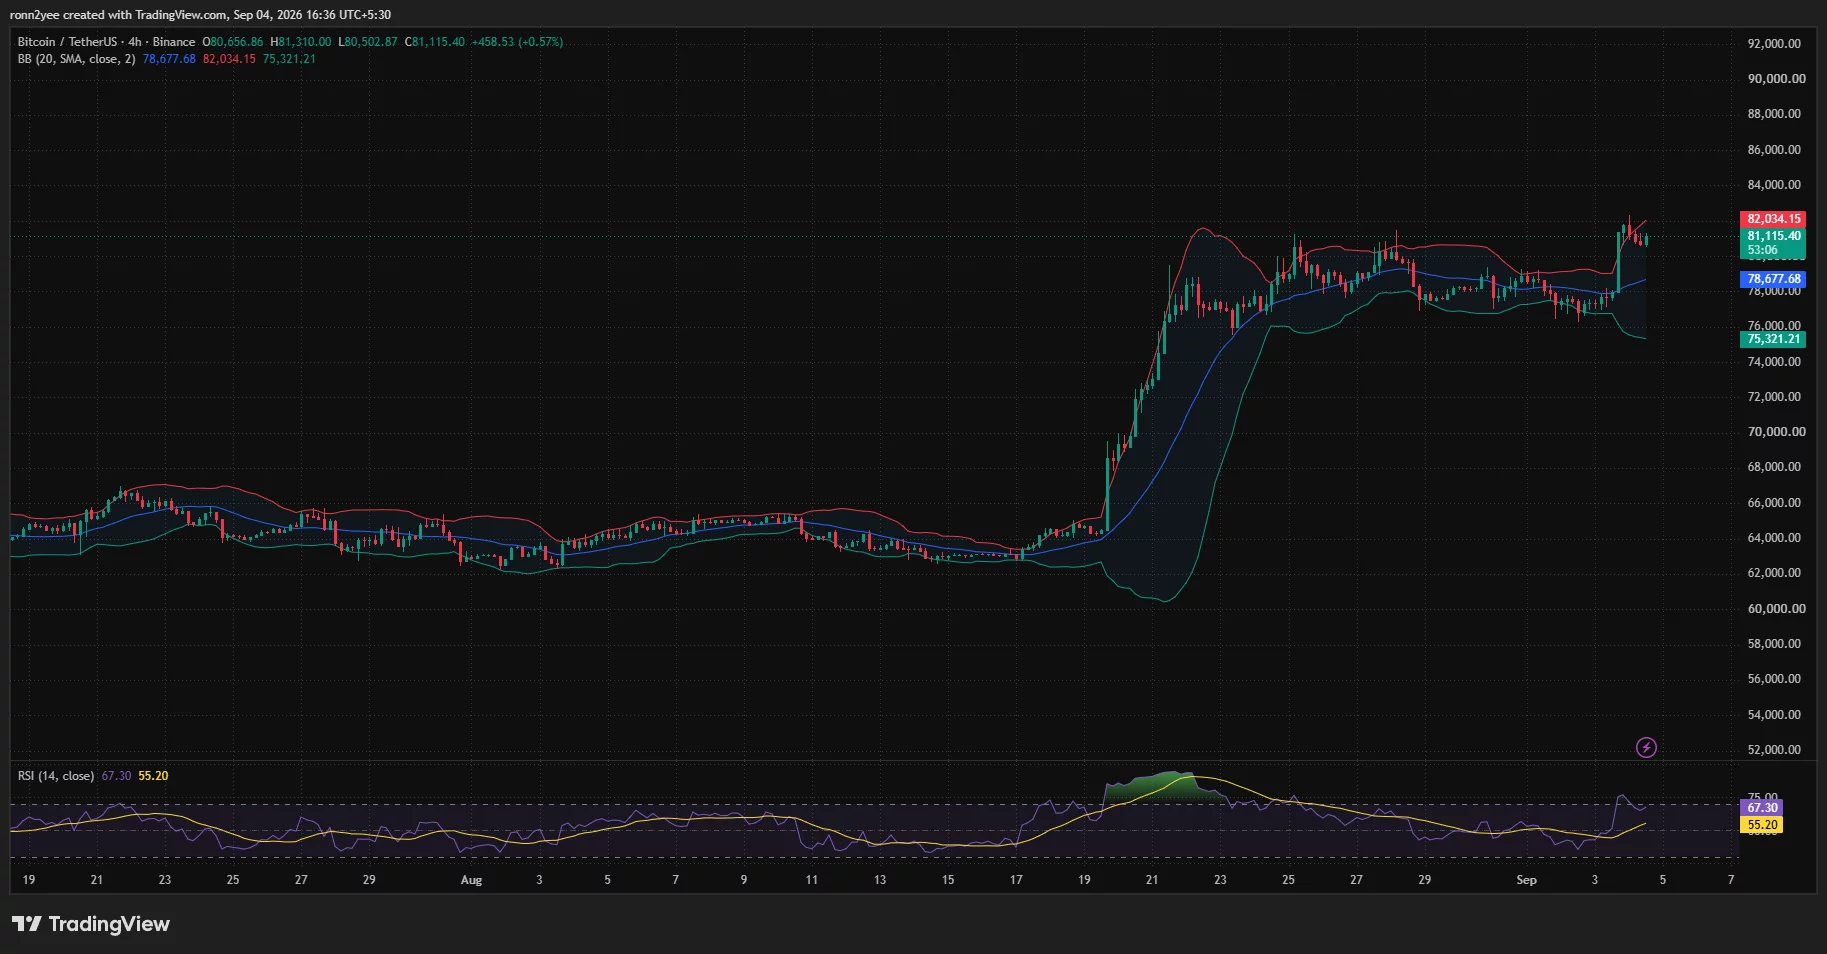
The 4-hour relative strength index was 67.3, just below the conventional overbought threshold of 70. Momentum remains positive, though the reading helps explain why the first move above $82,000 attracted profit-taking.
Liquidation levels frame the next Bitcoin move
The 24-hour CoinGlass liquidation heatmap shows a dense group of leveraged positions between approximately $81,700 and $82,300. A move back through that range could force additional short liquidations and help Bitcoin challenge the next supply area near $83,000–$84,000.
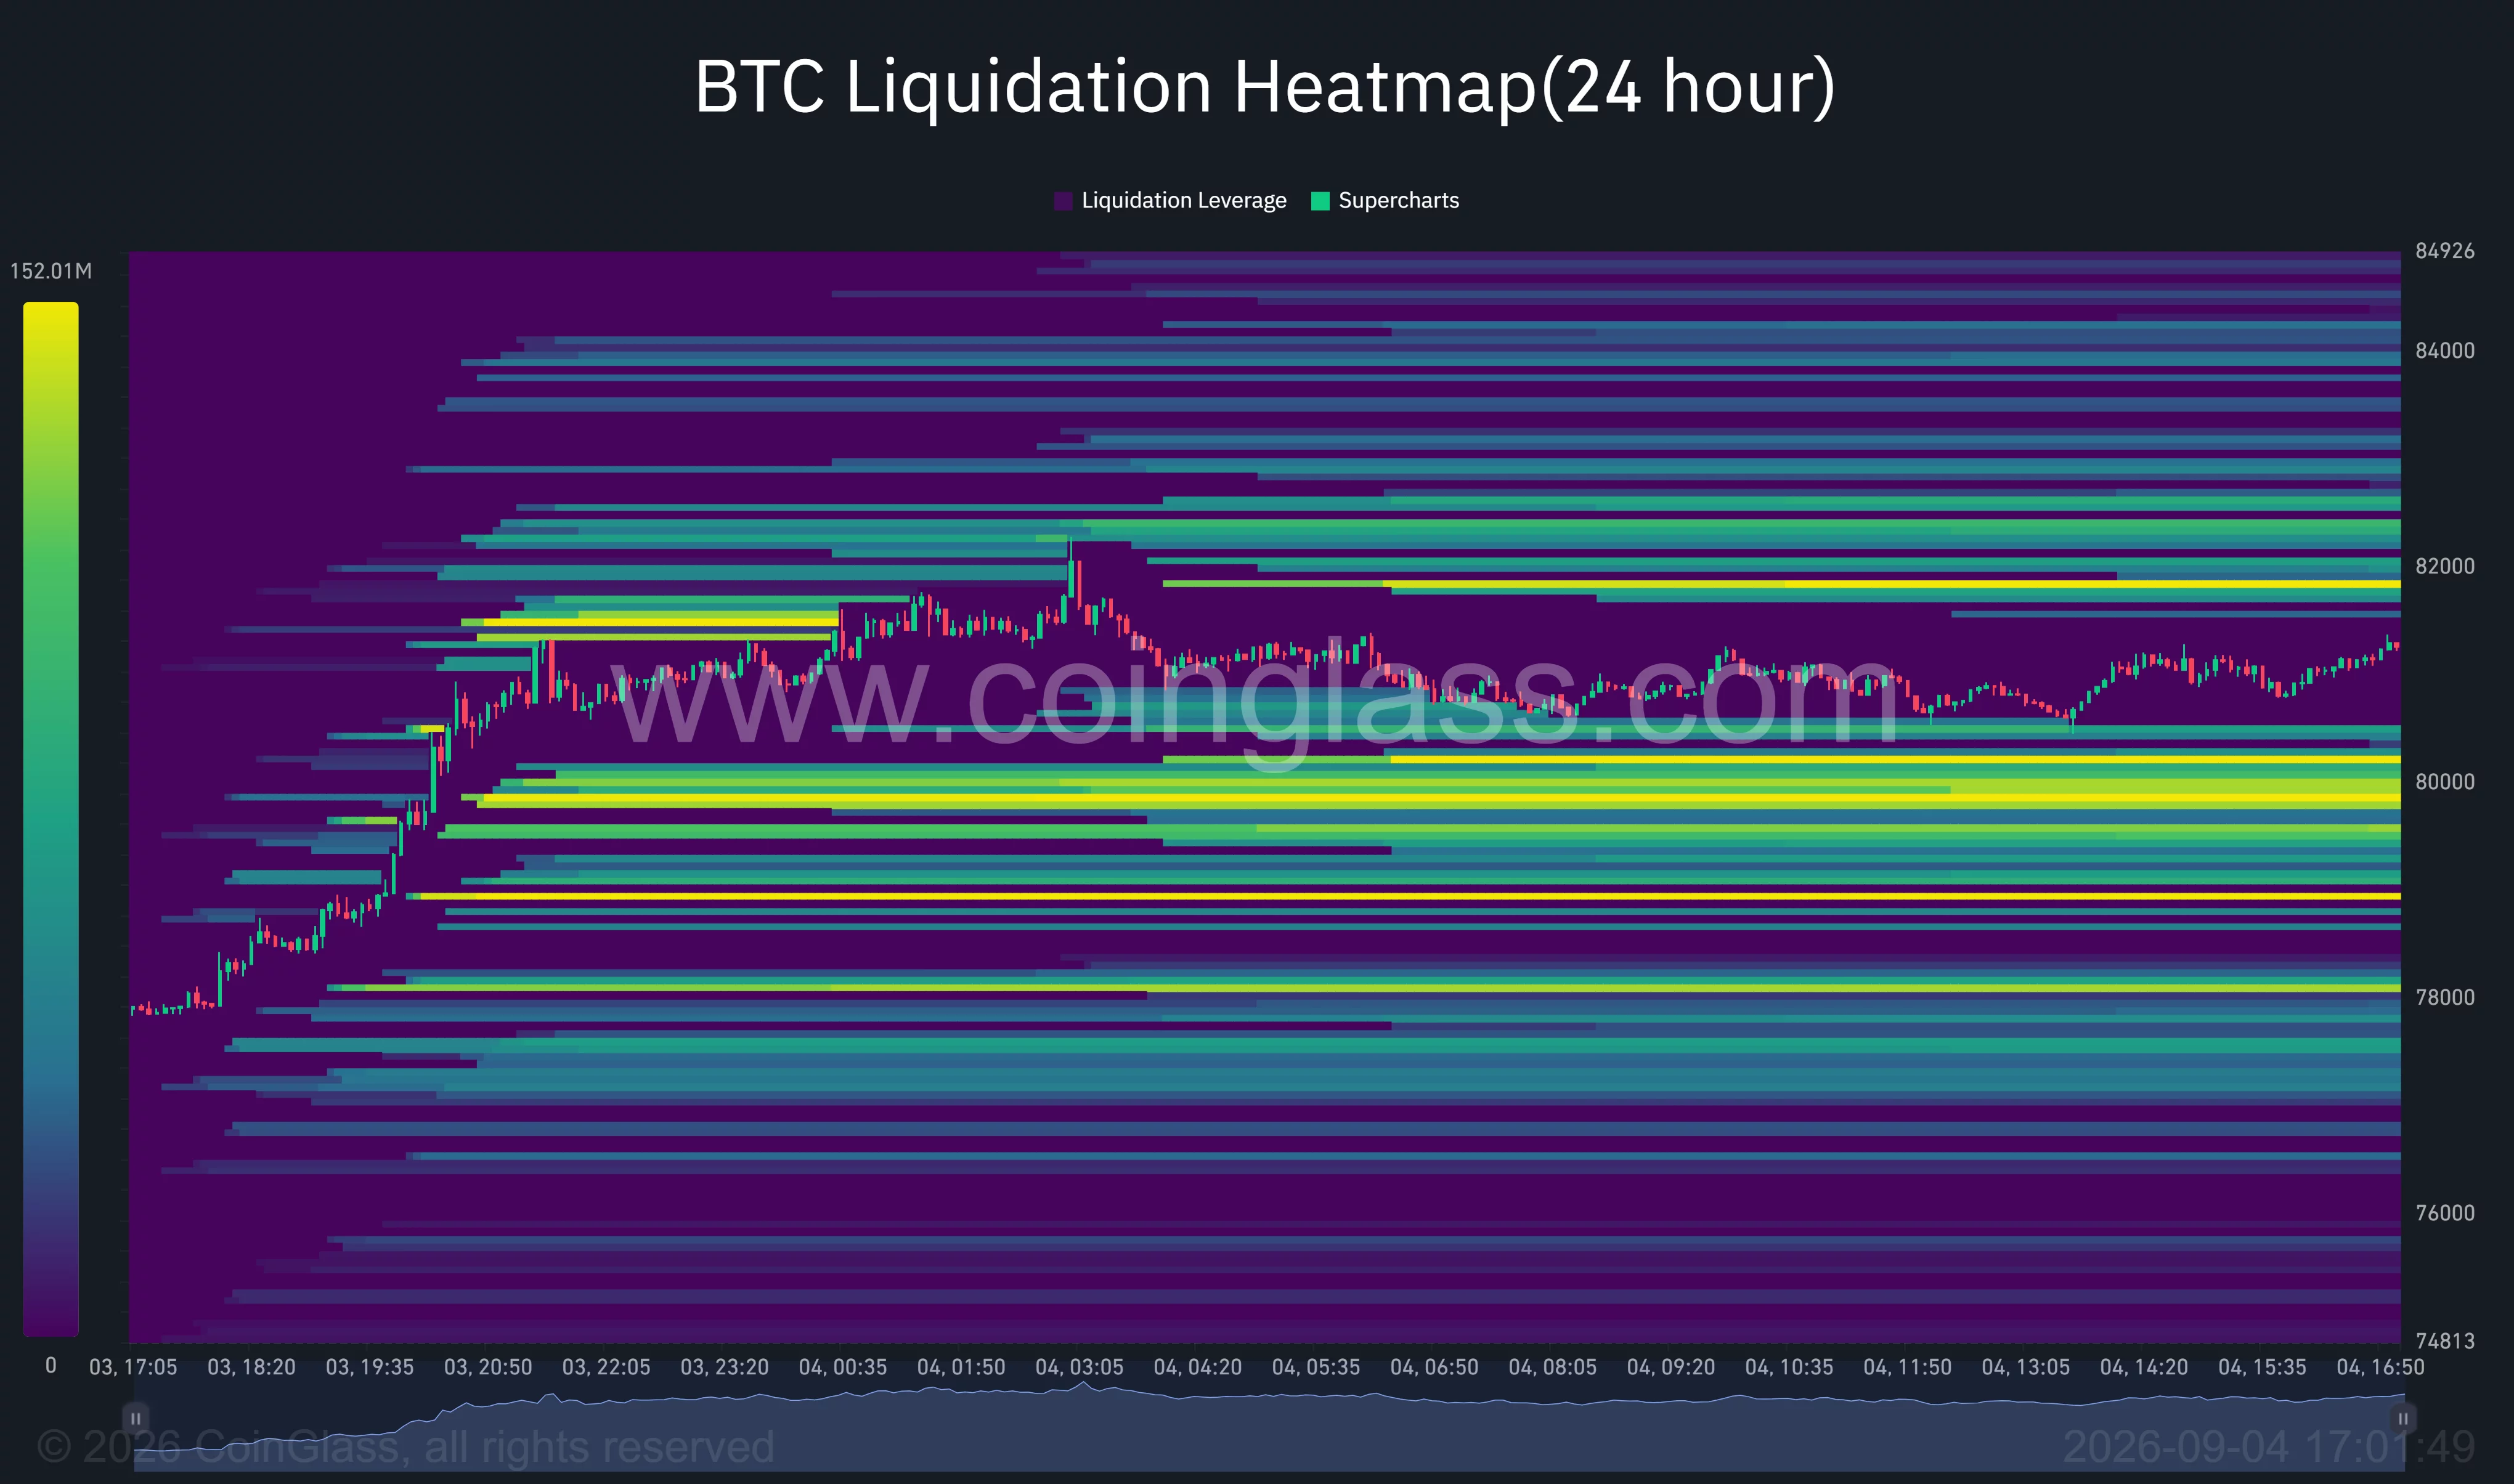
A larger concentration of liquidity is visible below the market between $79,800 and $80,300. Another band sits near $78,900, making both areas possible targets if Bitcoin loses $80,000.
The heatmap does not indicate which level the price will reach first. However, the concentration of leveraged positions on both sides raises the risk of sharp intraday swings as traders approach the weekly close.
Analyst Dami-Defi said Bitcoin had reclaimed a weekly exponential moving-average ribbon extending roughly from $71,000 to $78,000. According to the analyst, weekly closes above $78,000 would preserve the improved structure, while another loss of the ribbon would invalidate the reclaim.
The immediate bullish case requires Bitcoin to close above the 50-week moving average near $81,000 and clear the local high around $82,800. Such a move would expose $84,000, followed by the wider resistance zone between $95,000 and $96,000 identified by Dami-Defi.
Failure to hold $80,000 would instead put the $78,700 Bollinger midpoint and the weekly EMA region near $78,000 back in focus. A deeper decline could extend toward the 20-day moving average around $75,700.
Disclosure: This article does not represent investment advice. The content and materials featured on this page are for educational purposes only.